Trusted by Companies


Visibility across your infrastructure
Visibility across your infrastructure
Integrate real-time insights across your entire infrastructure for fast troubleshooting.
Scalable solutions with modern technology
Leverage best-in-class, cloud-based infrastructure that scales to your organization’s needs.
Best value to grow & enhance over time
Freemium & multi-tiered access help you save 10X what you’d spend on a legacy platform.
Out-of-the-box infrastructure configuration
Middleware Observability’s 50+ turnkey integrations enable you to get started in a few simple steps:
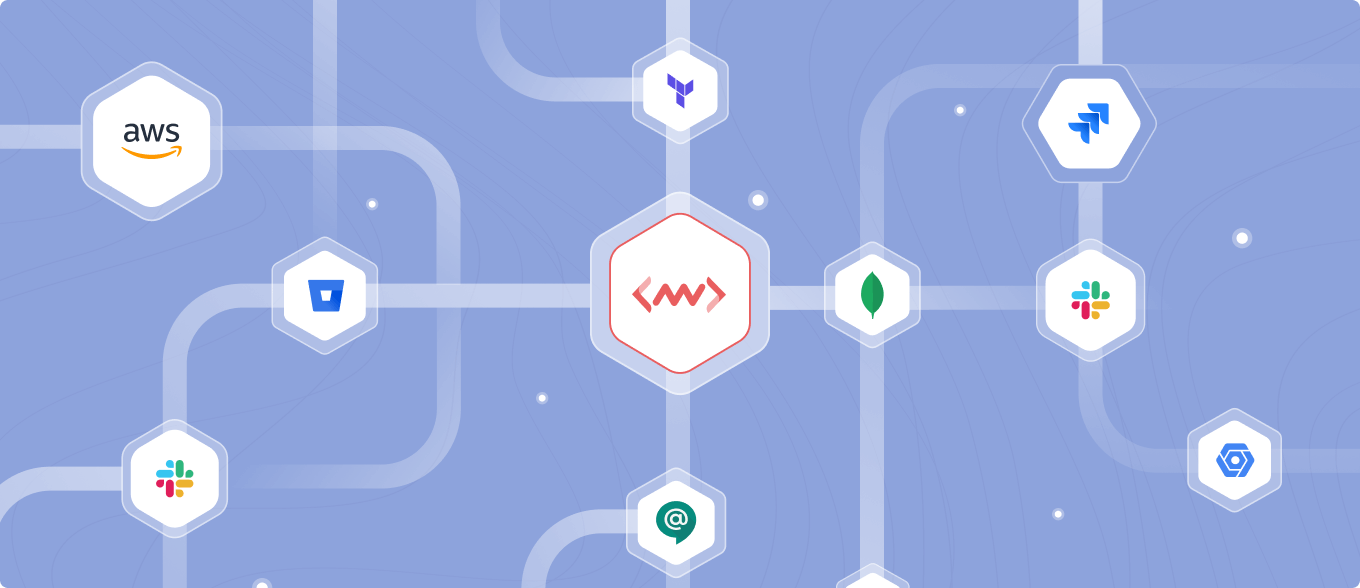
Set up infrastructure integrations like AWS, Kubernetes and more within minutes
Gather metrics from individual containers with open source agents
Full scalability gives you the foundation to start at your current level & build over time
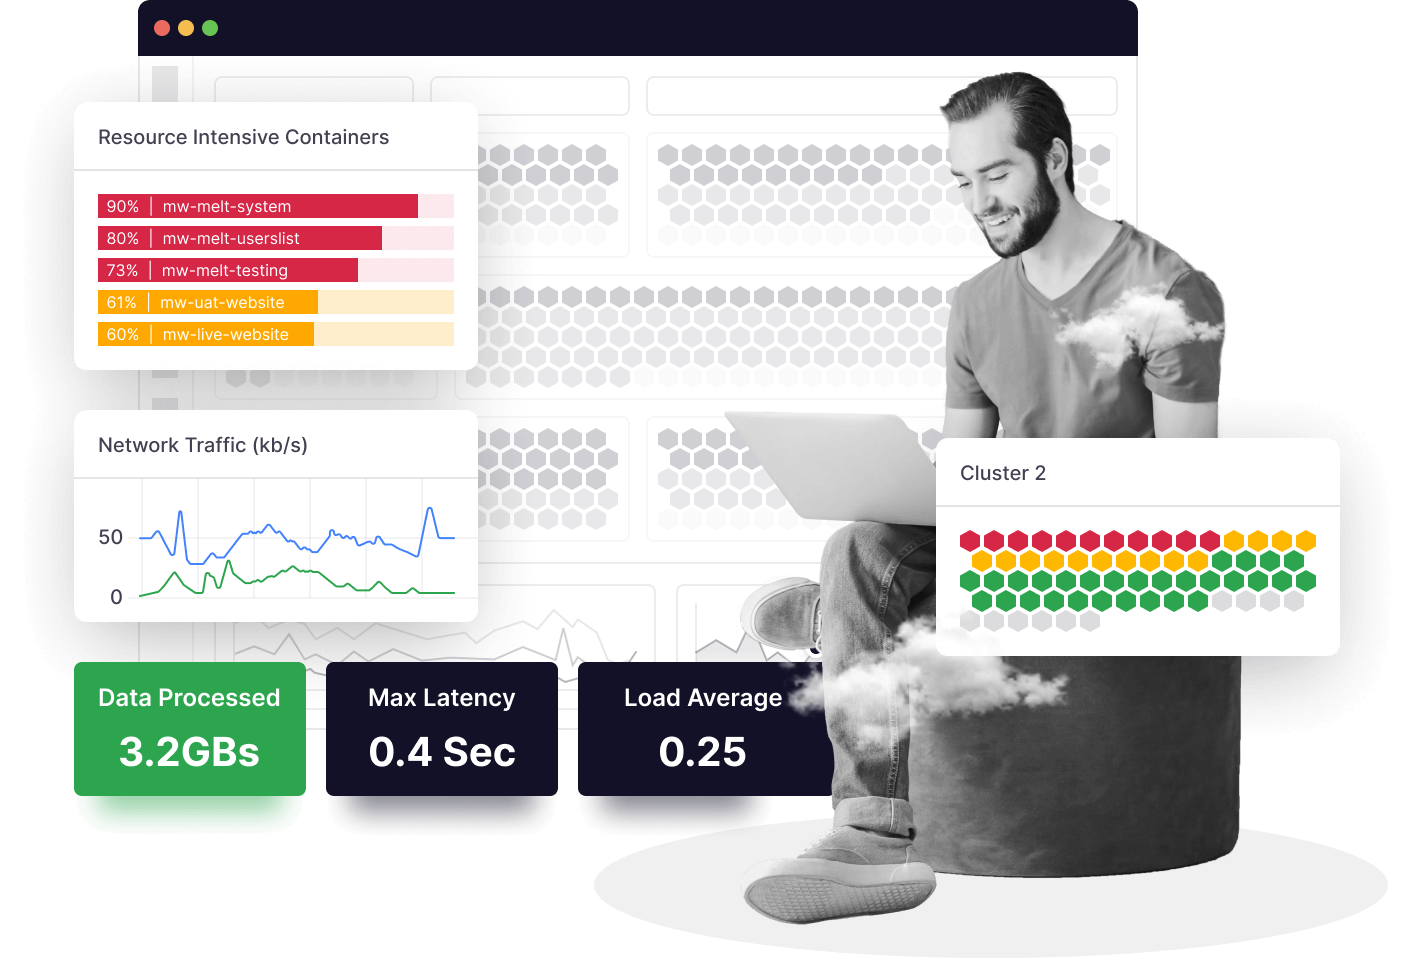
Detect infrastructure issues in real time
Connect correlation to causation and get to the root causes of issues with Middleware Observability’s infrastructure monitoring:
- Gather insights into specific technologies, containers, data sources and more with out-of-the-box dashboards
- Analyze deployments and changes and pinpoint issues on a unified platform
- View all logs, traces, and data in just a few clicks
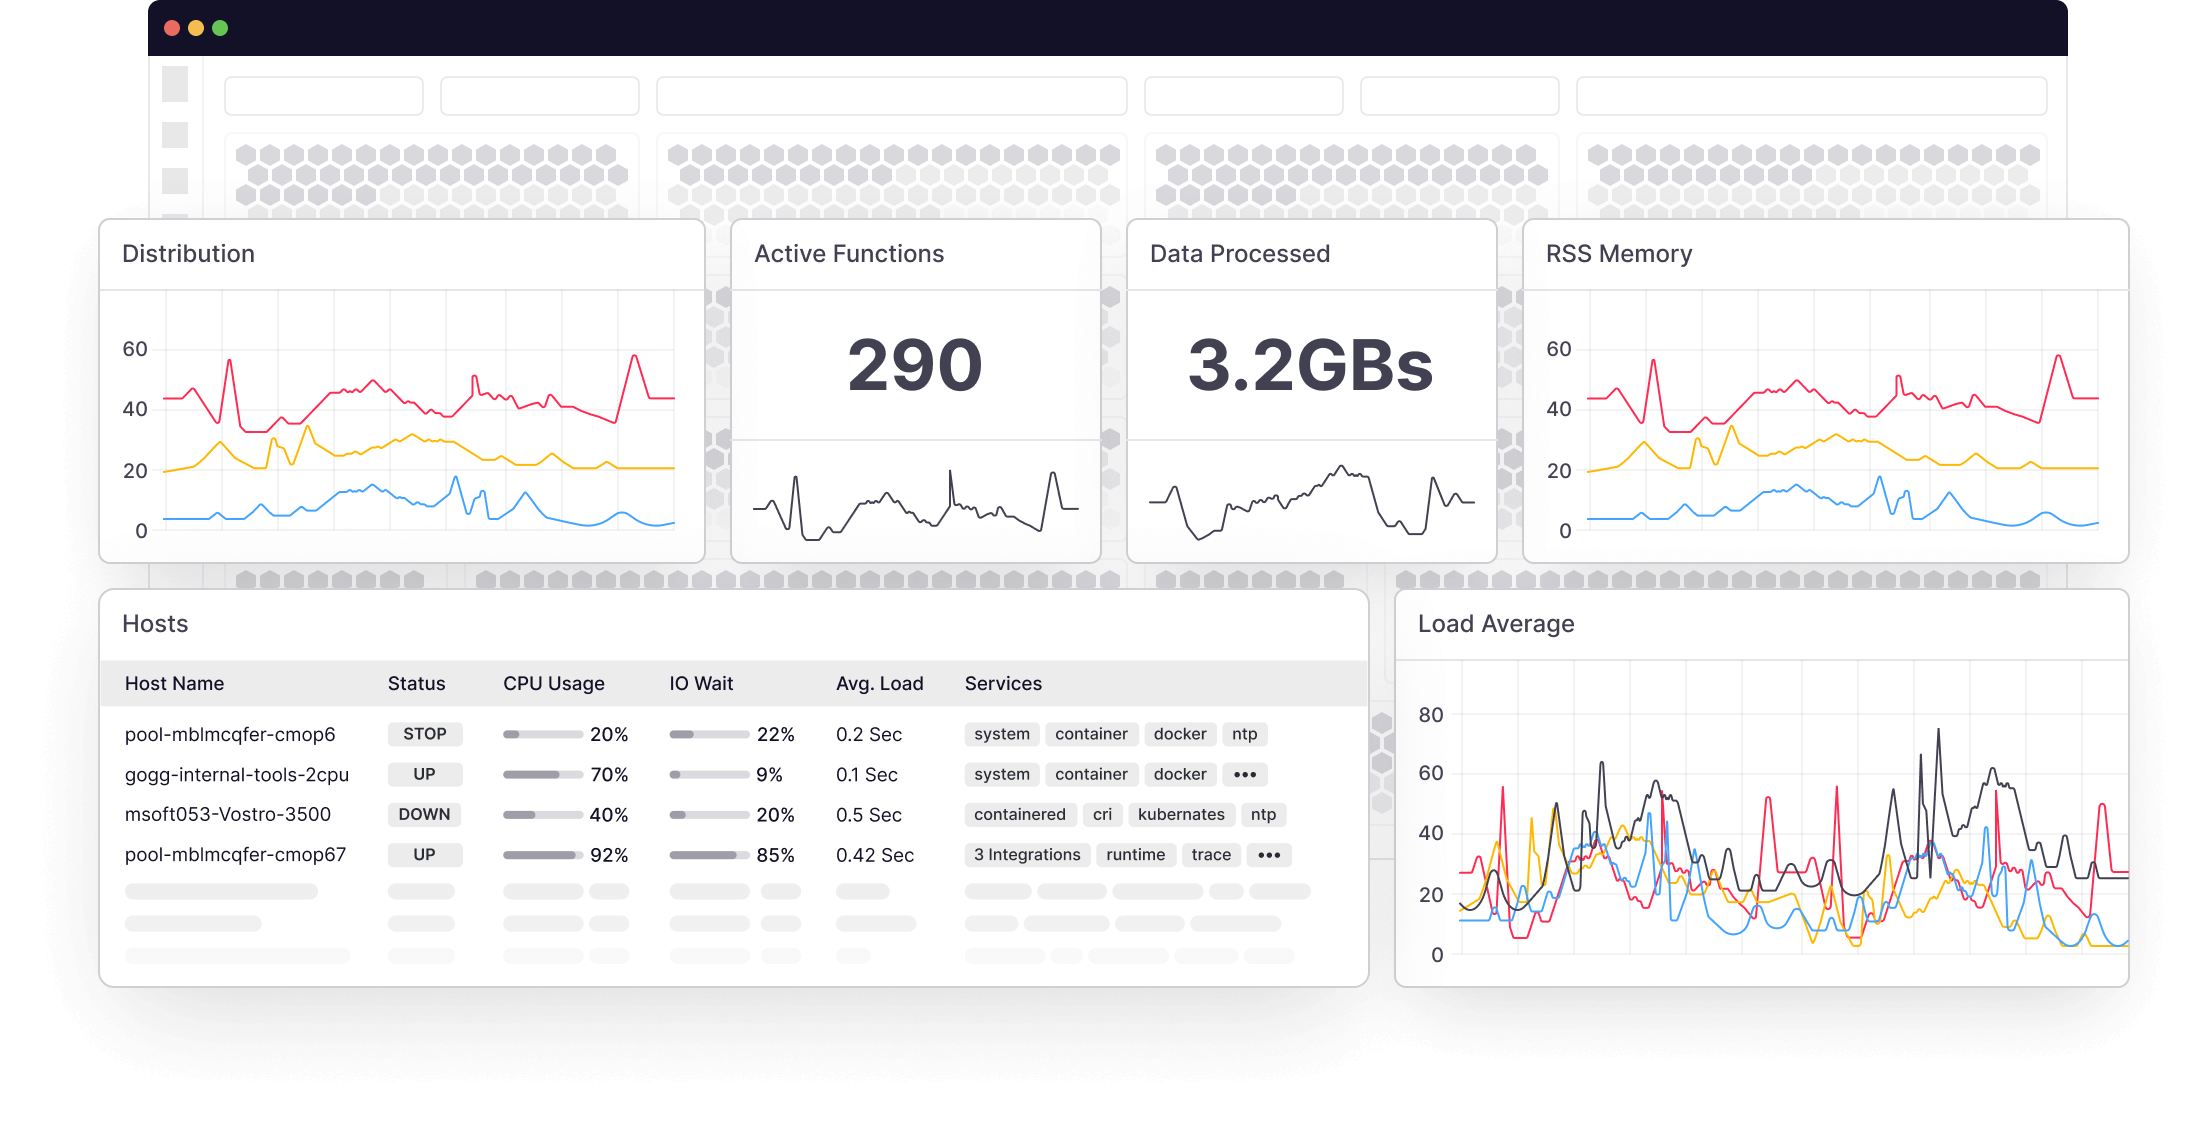
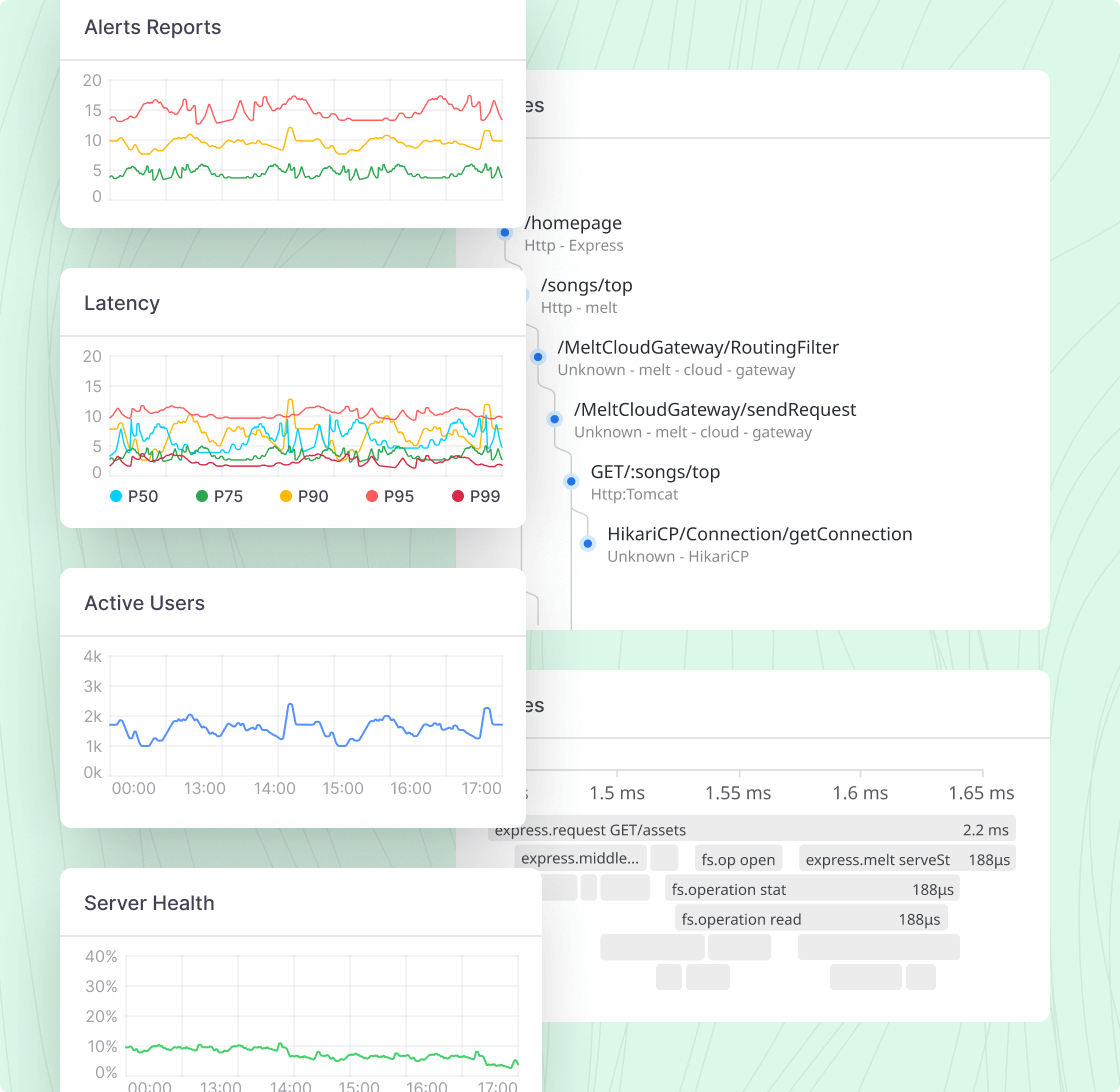
Enrich infrastructure monitoring with visualizations
Contextualize and analyze your disparate data with unified dashboards and visualizations:
- Monitor IT infrastructure metrics, distributed traces, logs and more from a single location
- Visualize server health, as well as the status of your serverless functions
- Develop AI-powered alerts for your engineers to enable real-time troubleshooting and problem-solving
Our top features
One-click deployment
Reduce onboarding time with one-click deployments, including automated tracking & versioning.
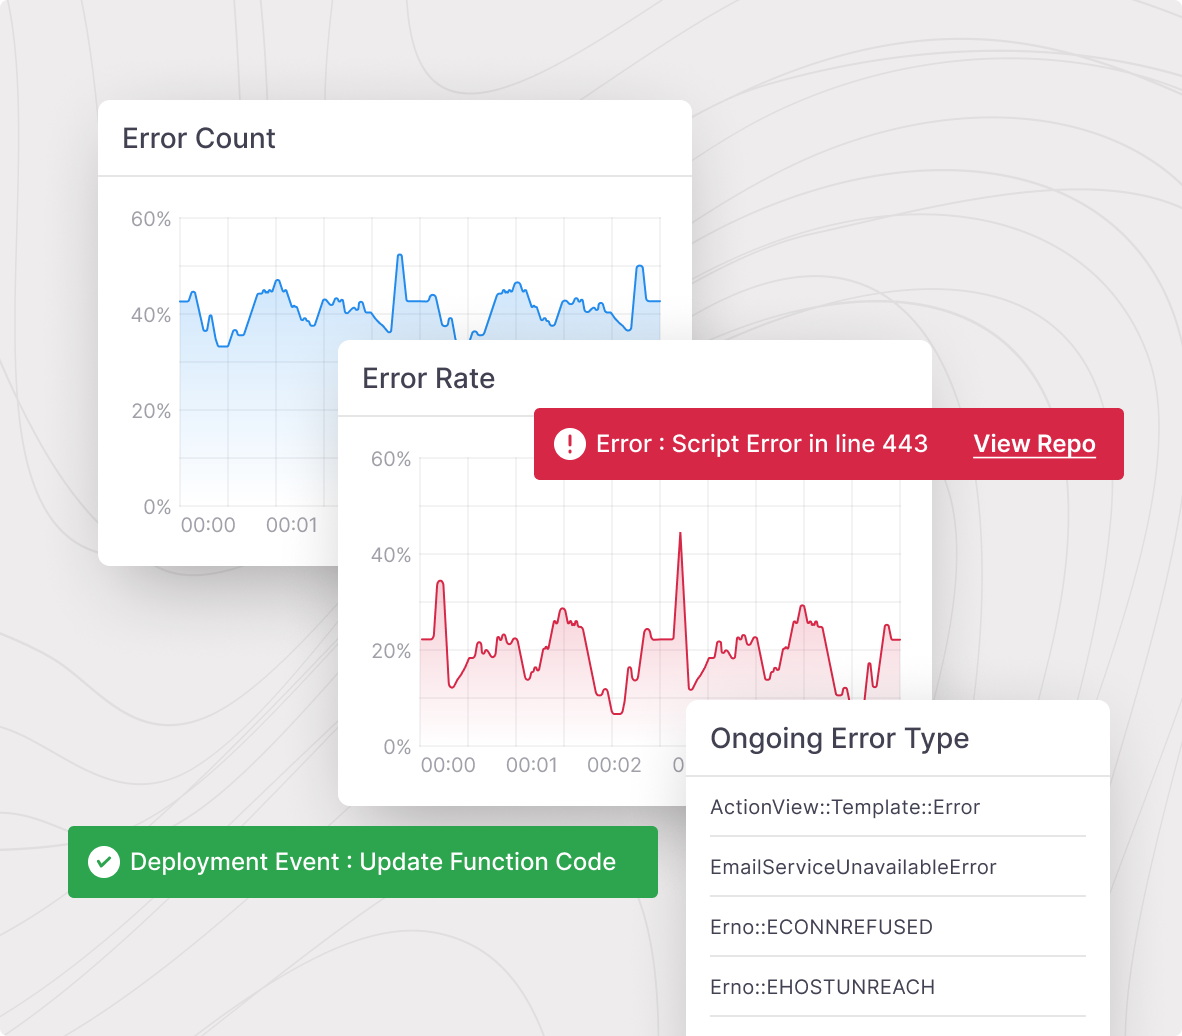
Performance monitoring
Identify errors, root causes, and impact radius so you can quickly and effectively fix them.
Data customization
Only receive the insights relevant to your business by customizing data inputs.
Advanced data mapping
Match fields among your various databases for transparency and accessibility.
Advanced filtration
Exercise precise control over the data you view for detailed, granular analysis.
Deep visibility
Gather deep insights from any individual host, or from the entire cluster.

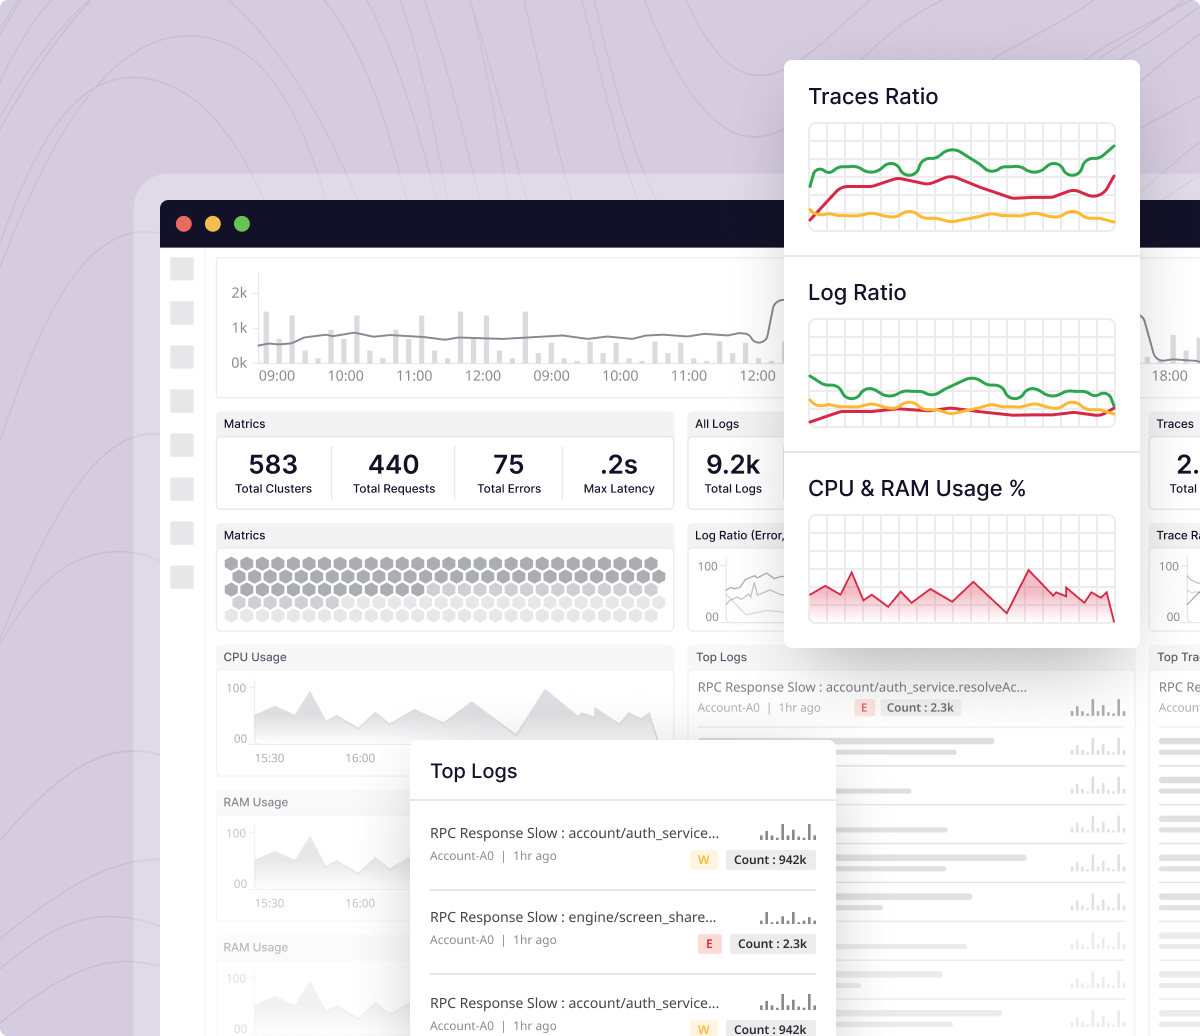
Unified dashboard for your entire stack
Bring together all your infrastructure data in one central location to allow for holistic insights and deep problem solving:
- Connect the dots between data sources, application performance, and user experience
- Identify the source of problems impacting multiple entities and quantify the impact radius of each incident
- Replay historical states to improve understanding & reduce time-to-action