Trusted by Companies


Complete system visibility and context at scale
Reduce troubleshooting time and MTTR
Empower your support team to identify & resolve front- and back-end issues quickly.
Gain full context into service relationships
Visualize connections between data to gain insights into root causes and impact radius.
Improve team collab. and productivity
Gain full clarity as to the source of errors and the teams responsible for fixing them.
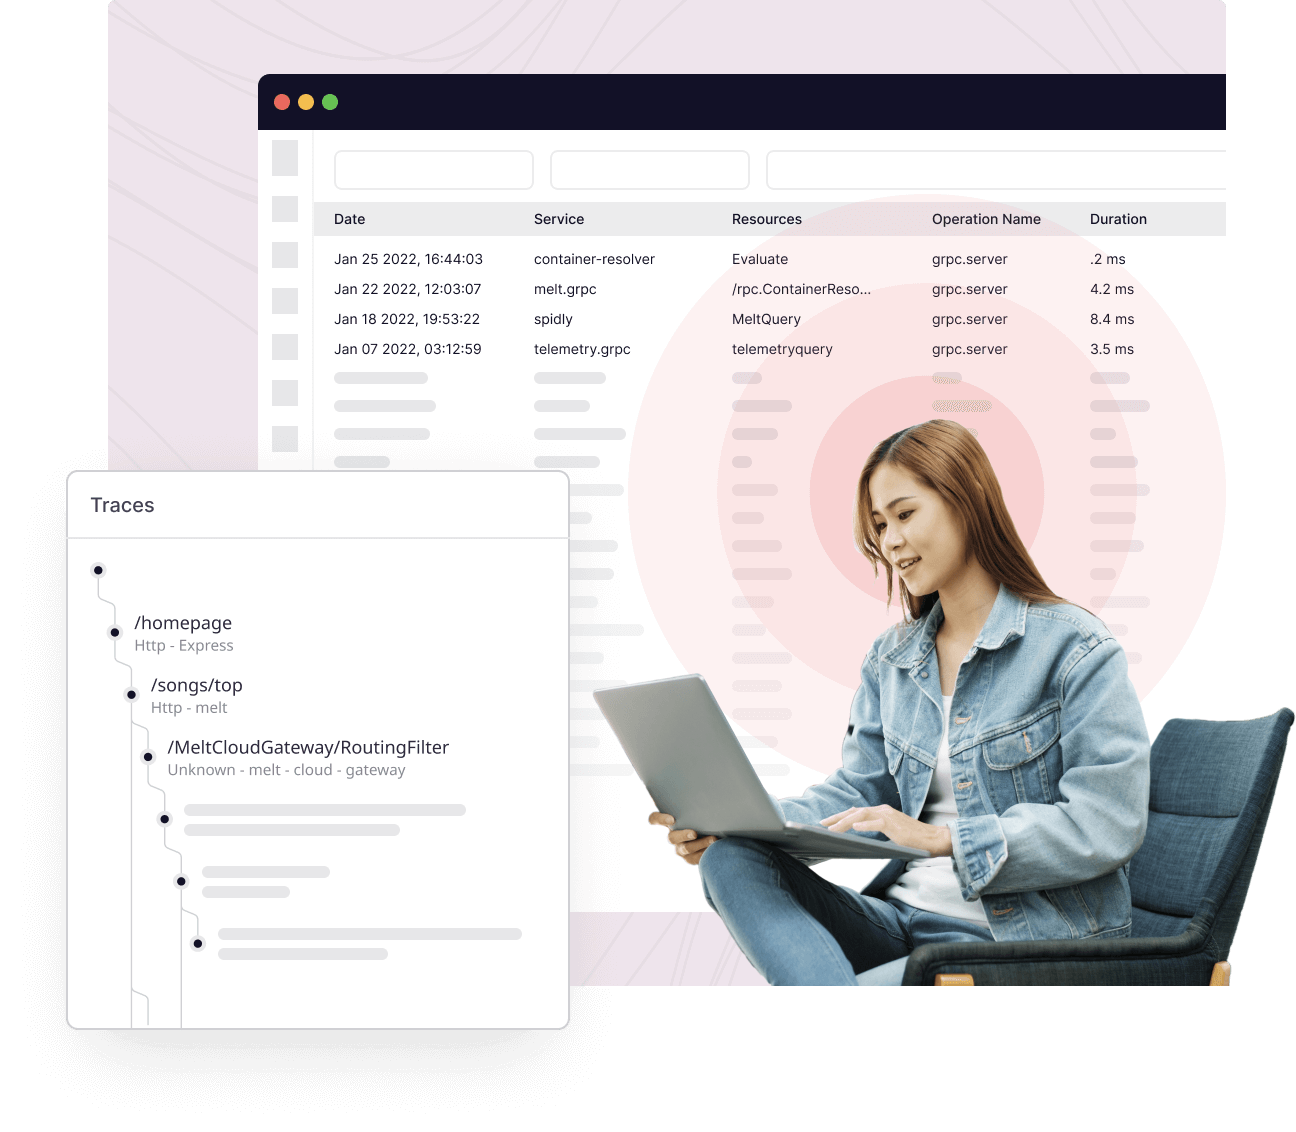
Collect traces from the first moment of interaction
Whether a user fills out a form or interacts with your system in another way, Middleware automatically begins collecting, analyzing, and contextualizing trace data.
View all interactions
View all interactions on a user level with auto-generated flame graphs
Correlate Interactions
Correlate specific user interactions and transactions to root causes
Data from multiple sources
Aggregate data from multiple sources to eliminate gaps within the trace
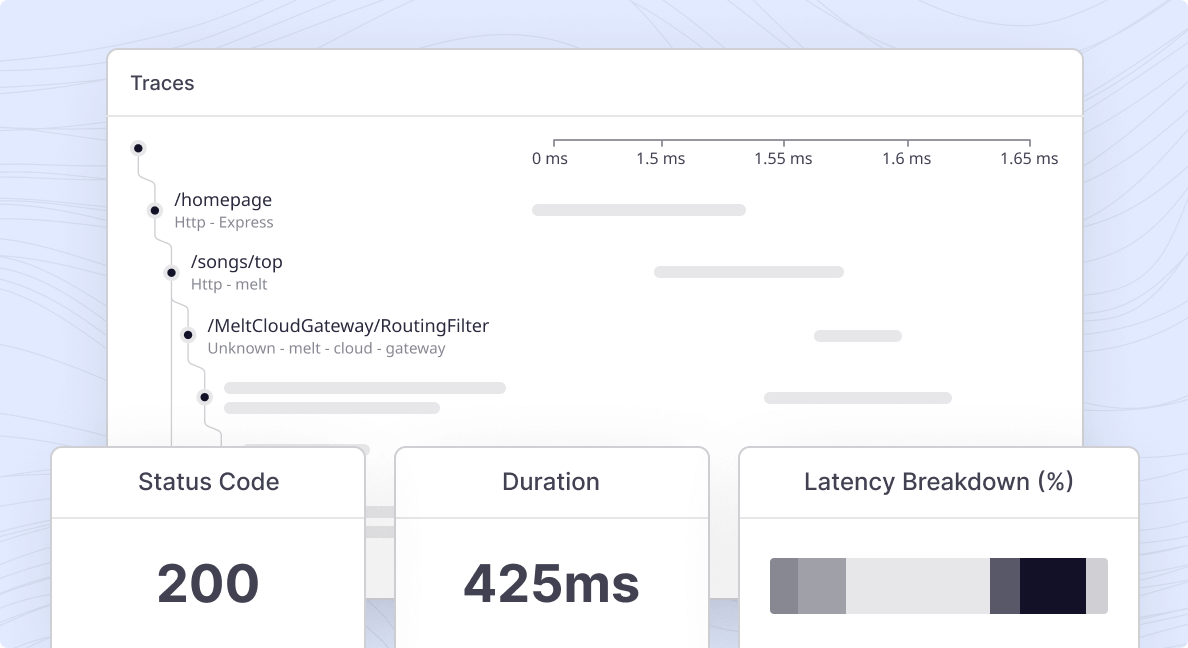
Reduce MTTR with root cause analysis
Don’t spend more time than necessary resolving errors when they arise. Connect the dots to find the root cause of any issue.
- Spot both the system causing the issue, and all other connected systems that could be affected
- Determine a precise course of action to resolve the error via monitoring workloads
- Find visibility into bottlenecks that may affect application performance
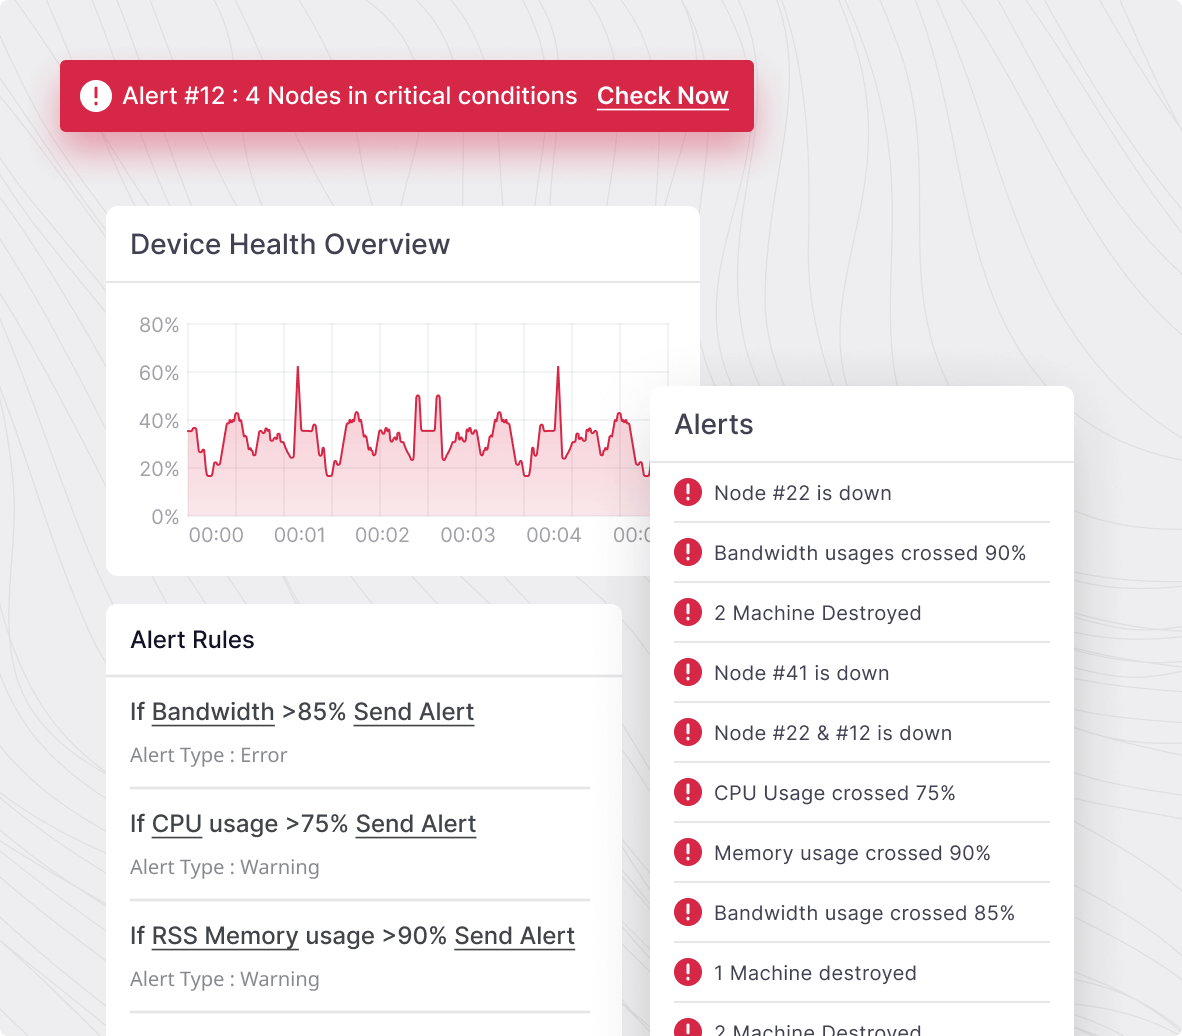
Support your observability needs at scale
With out-of-the-box functionality and AI-powered automation, Middleware’s powerful processing capabilities support your needs, whether large or small.
- Service complex, modern cloud-native architectures, as well as on-prem or hybrid environments
- View telemetry data through dashboards and workflows that identify and surface critical metrics
- Automatically set up tracing as you add new systems and technologies to your stack
Our top features
End-to-end distributed tracing
Follow each request from the source to see root causes & fix errors faster.
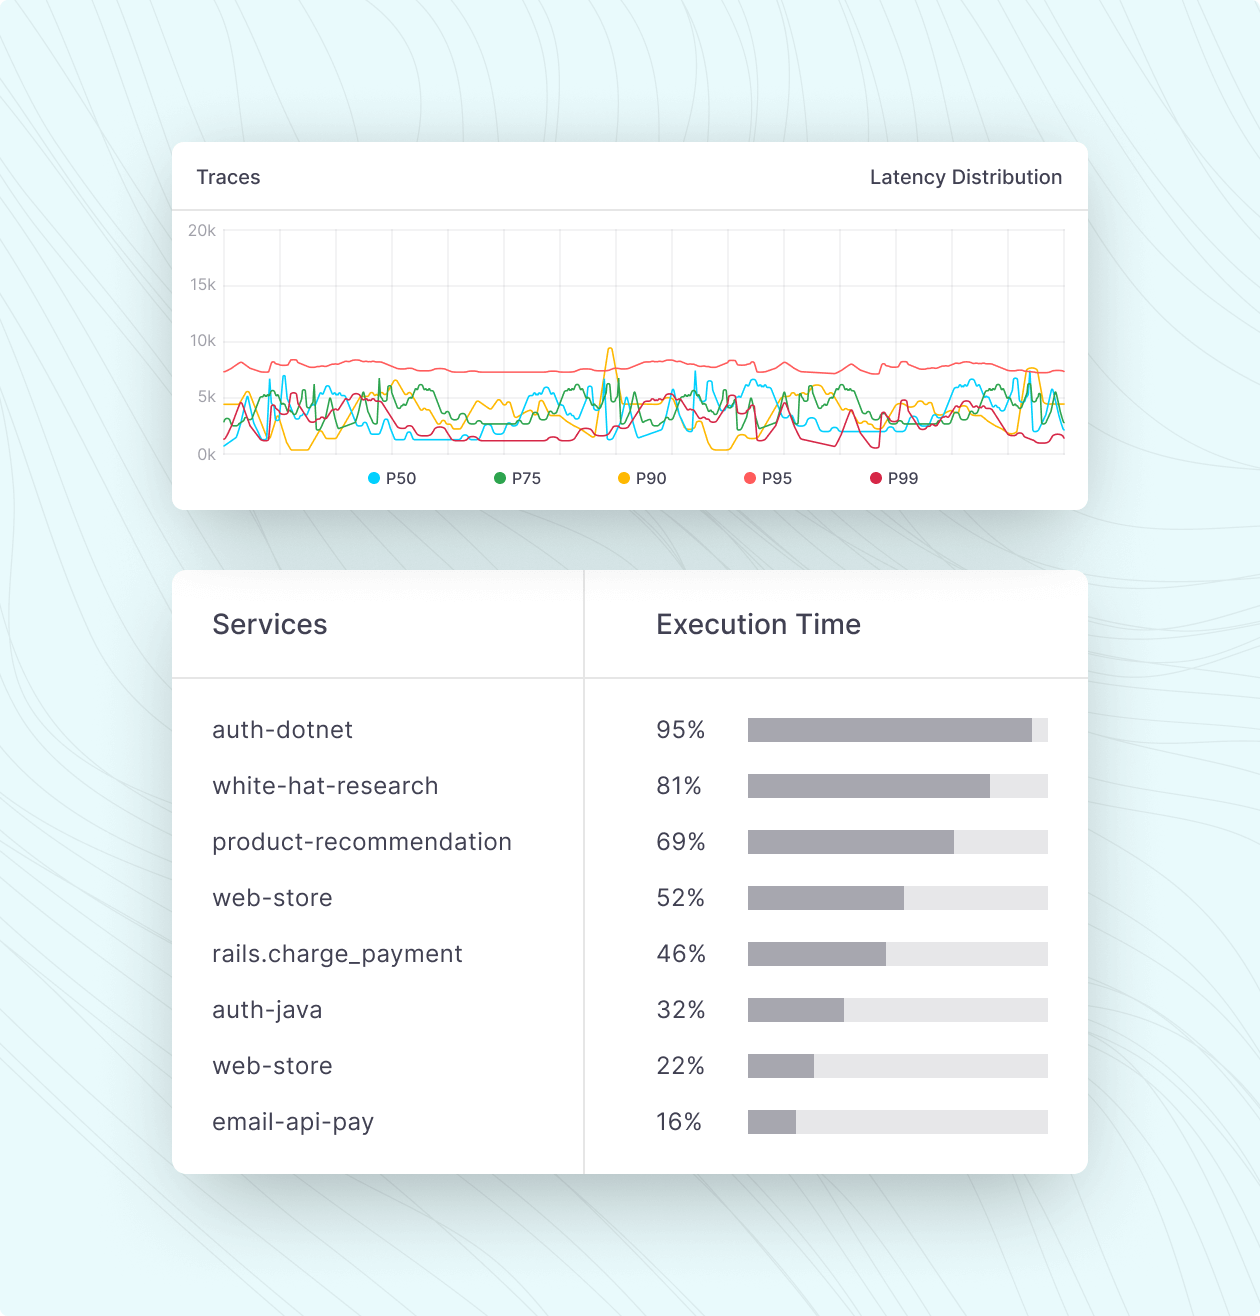
Continuous profiler
Analyze program complexity to identify which functions are using the most resources.
Metric & log correlation
Connect the dots to find root causes and measure the impact radius of an error.
Live query
Search and analyze all your traces in real-time with tag-based queries.
Resource optimization
Streamline your performance by identifying high-resource functions & fixing them.
Deployment tracking & versioning
Track all deployments and versions over a set period so you can continuously improve.


Eliminate silos with 50+ integrations
Gain complete visibility into data from AWS, Google Cloud Services, Kubernetes, Azure, and more with Middleware’s vendor-agnostic framework.
- Use identifiers and tags to correlate specific user interactions to the appropriate system
- Gather traces that link a specific transaction’s span across your entire infrastructure
- Collect traces from different coding languages, distributed microservices, and more