Trusted by Companies


Complete system visibility and context at scale
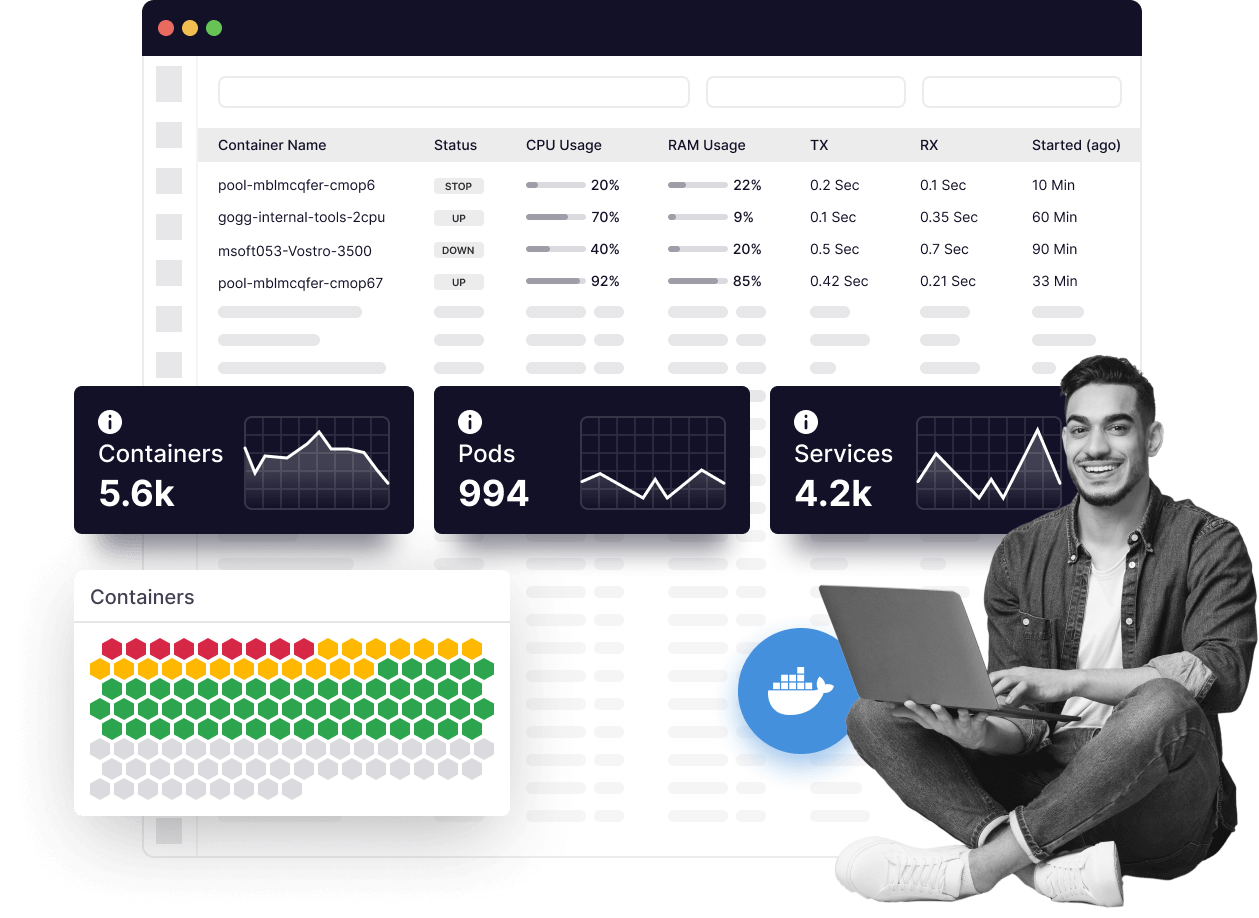
Full visibility into containers
Solve problems in real time with integrated visibility into all containerized & Docker environments.
Integrate data from multiple sources
Collect data from Kubernetes, applications, pods, Dockers, microservices, metrics, & traces.
Scale as your ecosystem grows
Freemium & multi-tiered access enable you to invest at your current level and scale over time.
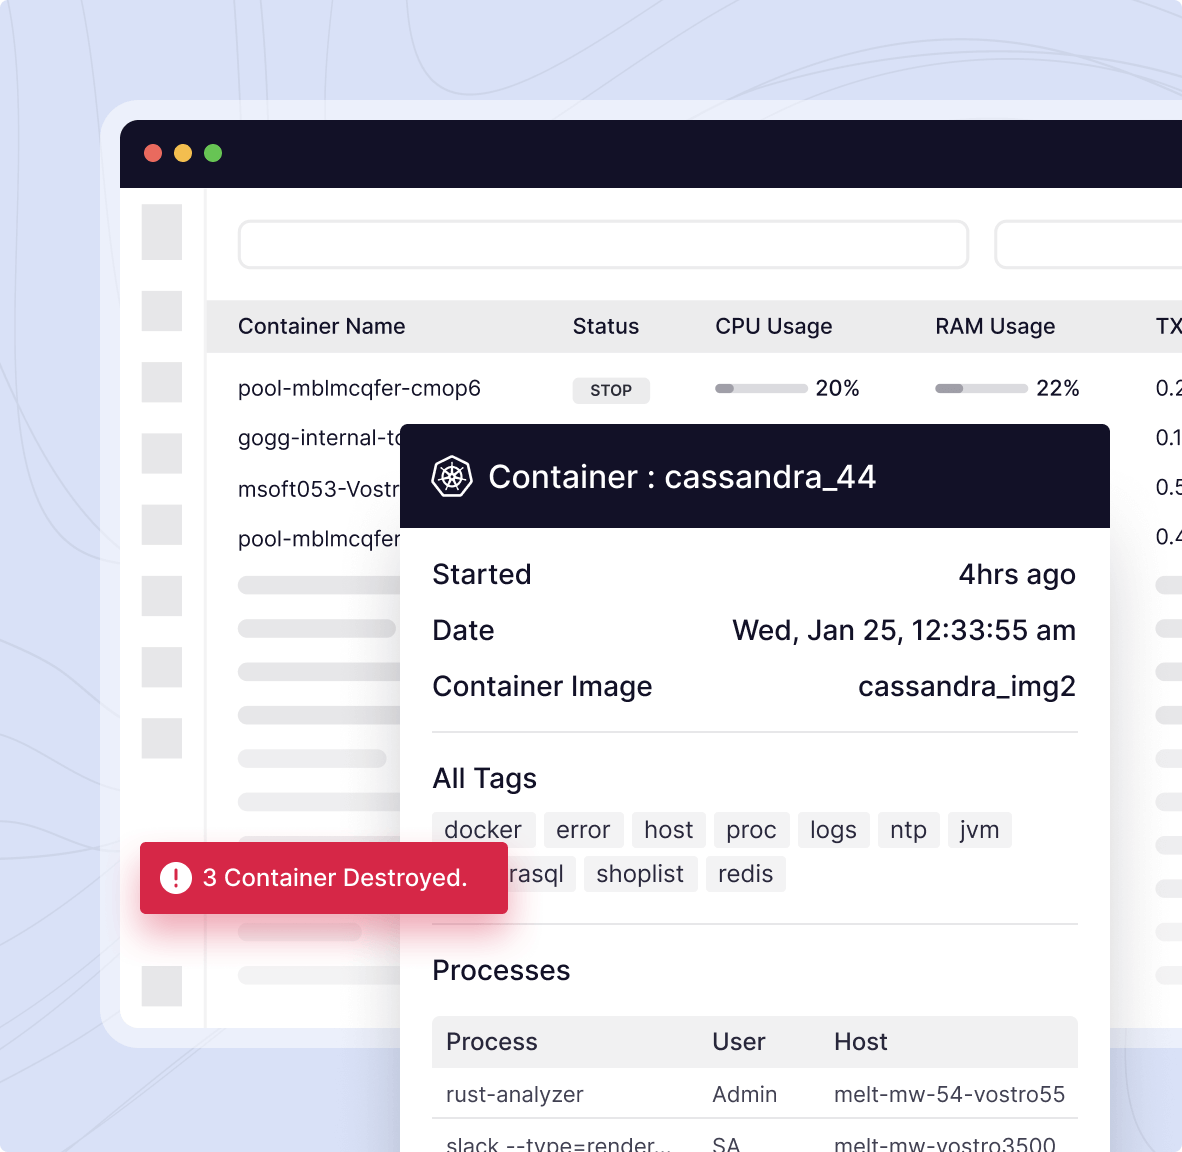
Auto-discover containers out of the box
Reduce time-to-action & increase server uptime. Middleware creates real-time visualizations of your container map so you can:
- Detect when containers are created and destroyed
- Automatically discover services no matter where they spin up
- Collect detailed, real-time overviews of each container’s health, resource consumption, & deployment status
Get to the root cause of issues
Middleware container monitoring improves your application performance with deep insights to troubleshoot in real time.
- Seamlessly move from correlation to causation by connecting metrics, logs, traces, & network data
- Surface critical information about each layer of your Kubernetes clusters
- Run endpoint checks against external services, applications, & data sources
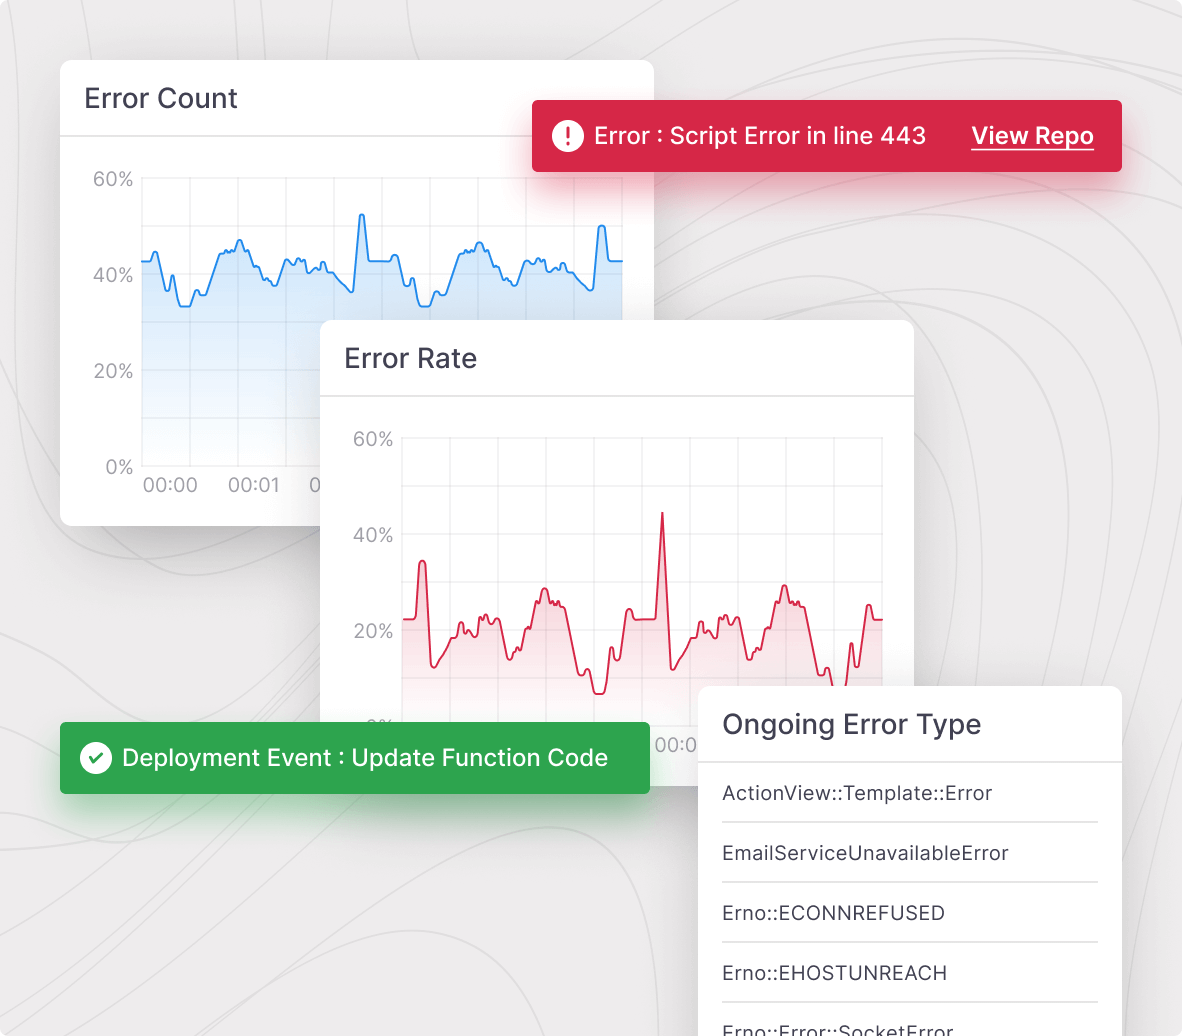
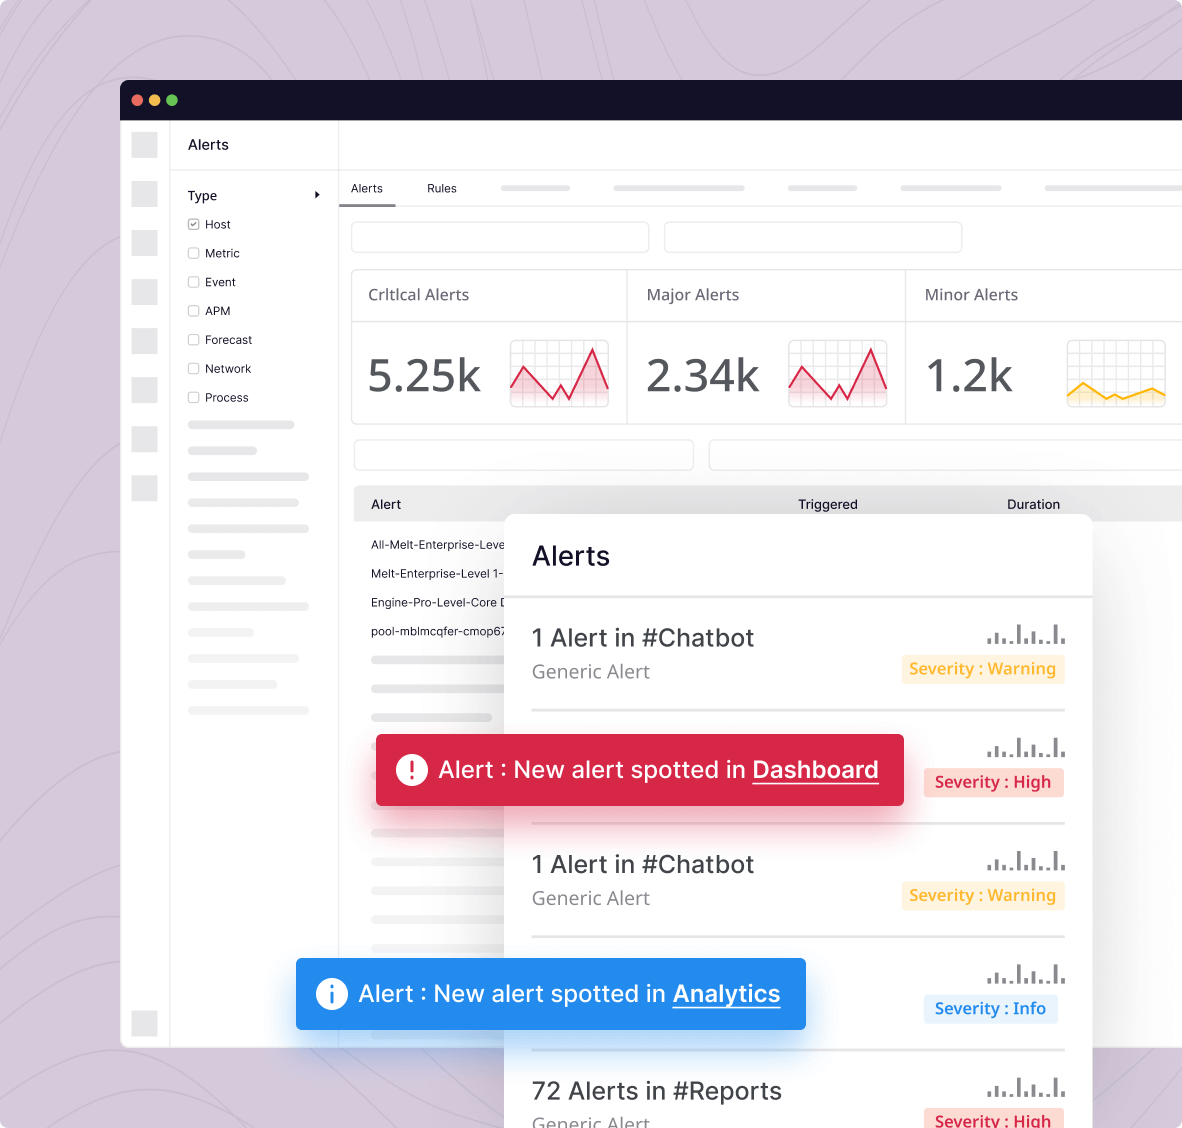
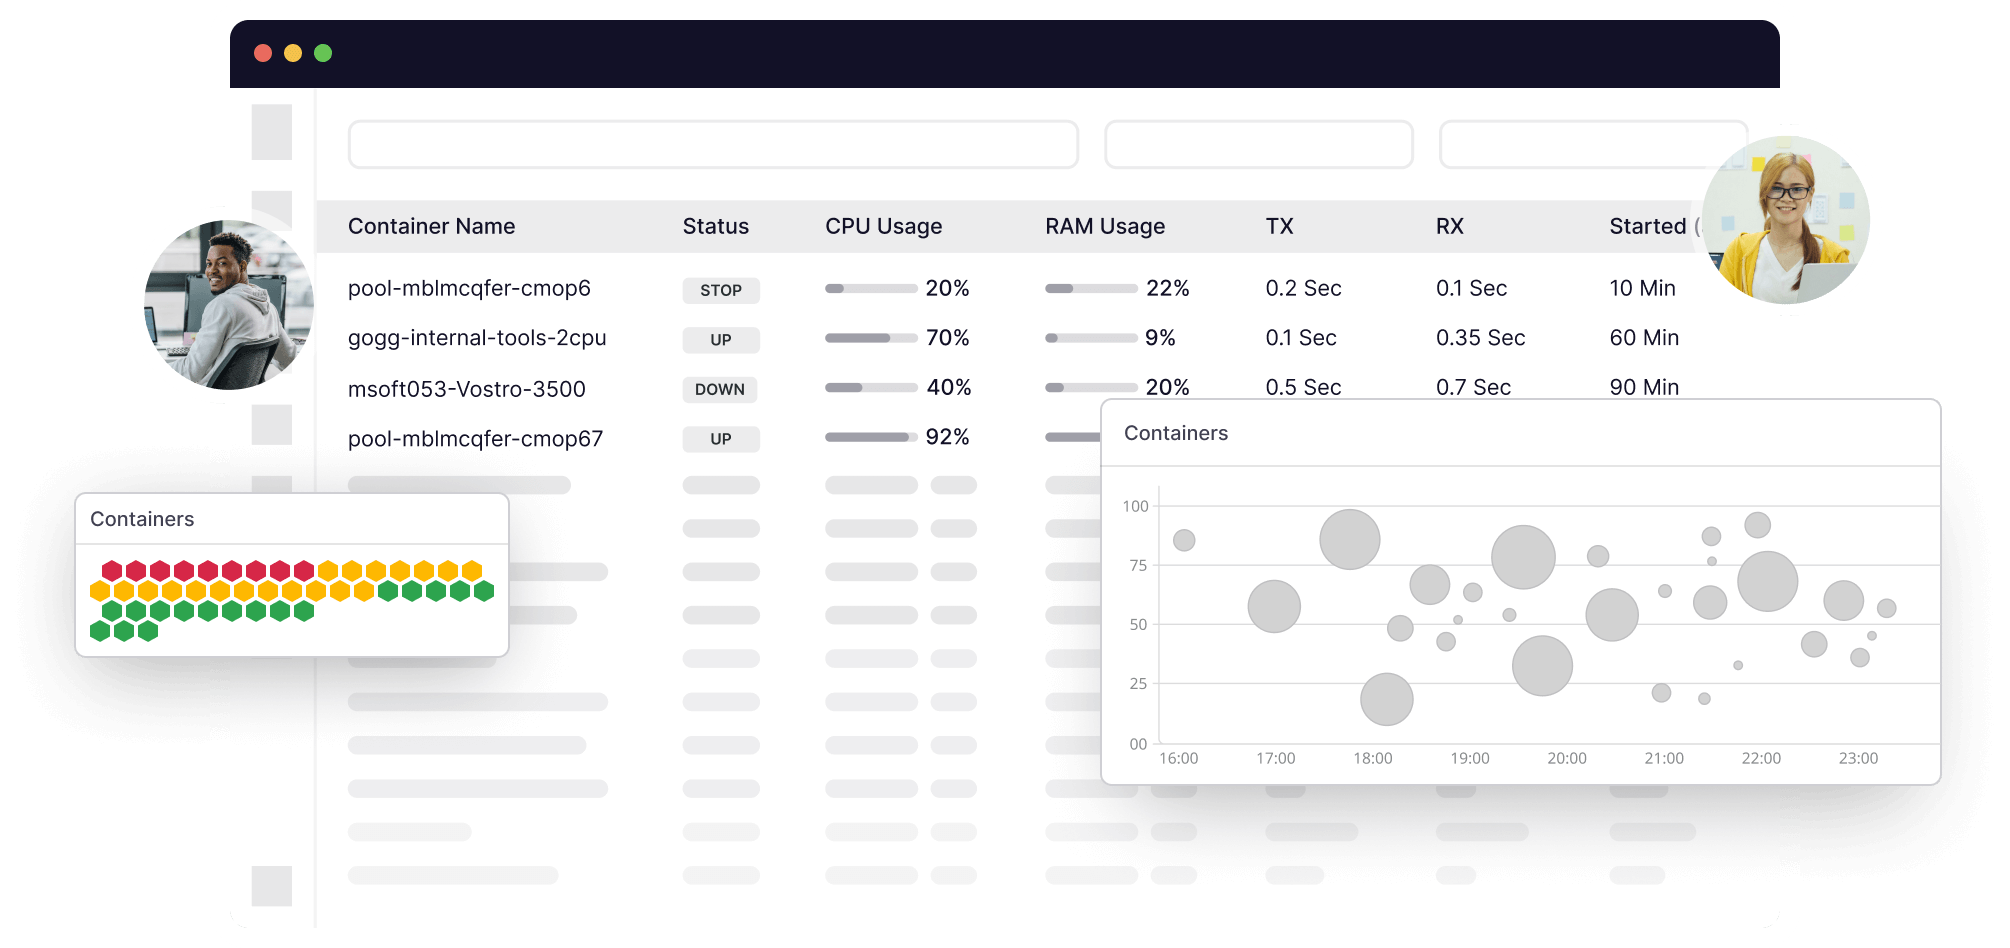
Receive alerts & insights in one location
Optimize data analytics with visualization and dashboards for a clearer understanding of front- and back-end experiences:
- Spot emerging issues in real time—no need to pre-configure your alerts
- See performance across your entire ecosystem on a single screen
- Visualize metrics and traces to pinpoint root causes
- Receive instant threat alerts when suspicious activity occurs inside your clusters
Our top features
Kubernetes as core
Proactively manage all clusters & track resource usage with a solid Kubernetes foundation.
Automatic microservice discovery
Reduce time and workload by automatically locating applications & microservices within your network.
Cluster-level monitoring
View the health of your Kubernetes clusters in real time so you can respond to issues quickly.
Suspicious activity alerts
Automatically detect early warning signs that could compromise your Kubernetes clusters.
Real-time metrics
Identify and analyze small errors before they cause bigger problems across your containers.
Unified logs, traces, & metrics
Analyze all relevant observability data from a centralized location that monitors all your containers.

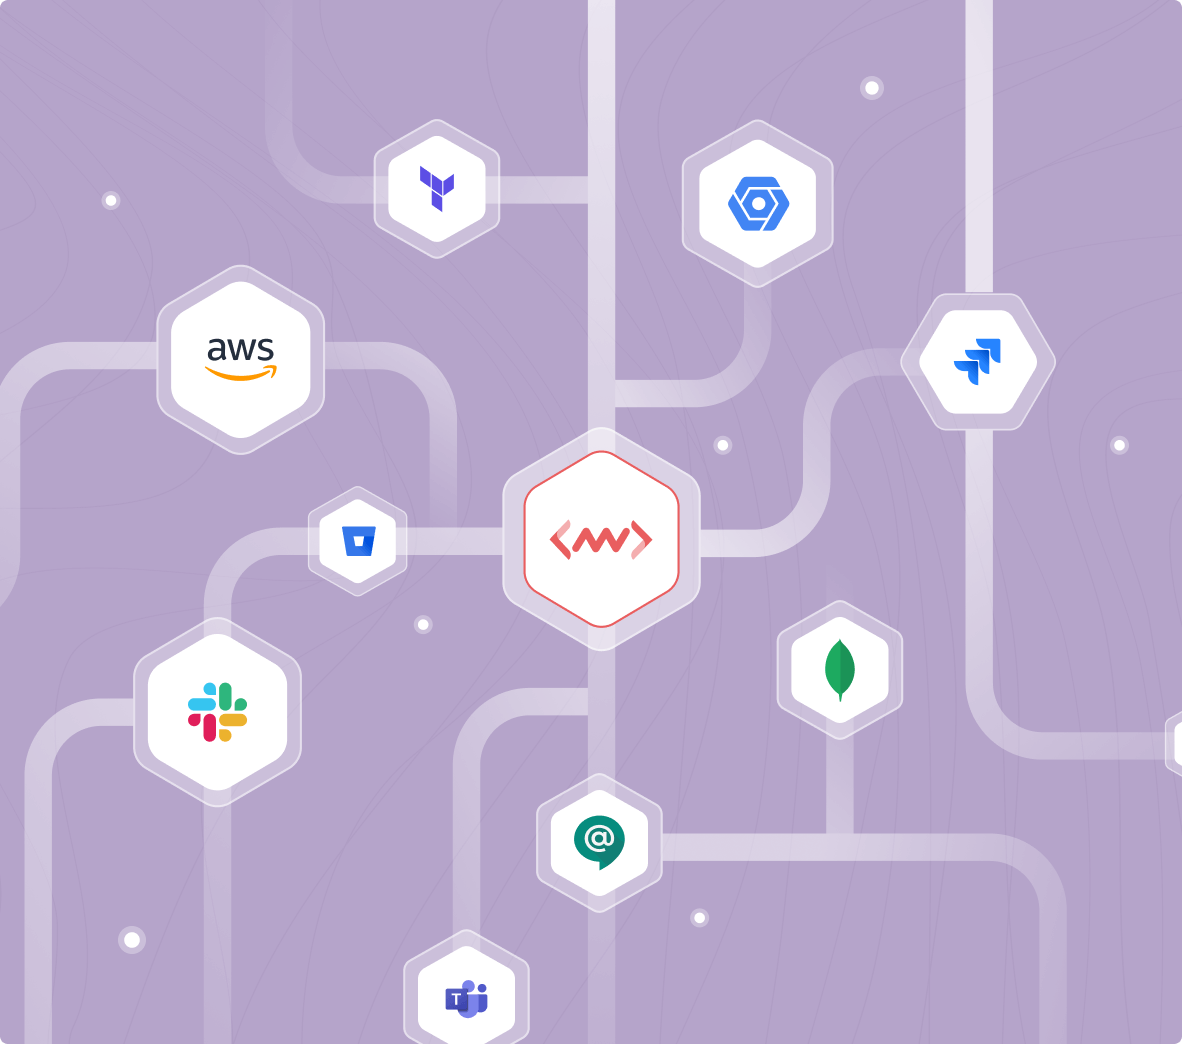
Monitor your entire infrastructure
Leverage over 50+ integrations—including AWS, Azure, GCP & more—to monitor your entire infrastructure, including cloud, hybrid, and serverless containers:
- Troubleshoot issues with distributed tracing for each component
- Monitor per-container metrics, including resource usage, response error rates, and more
- Leverage built-in dashboards to operate from a single source of truth