Trusted by Companies


Find problems before they
become headaches
Middleware leverage machine learning & tags to quickly respond to potential and actual
infrastructure errors—minimizing downtime and reducing alert fatigue.
Automate alerts with AI-powered technology.
Automate alerts with AI-powered technology.
Automatically construct and apply alerts across your entire infrastructure, so you never miss what’s happening.
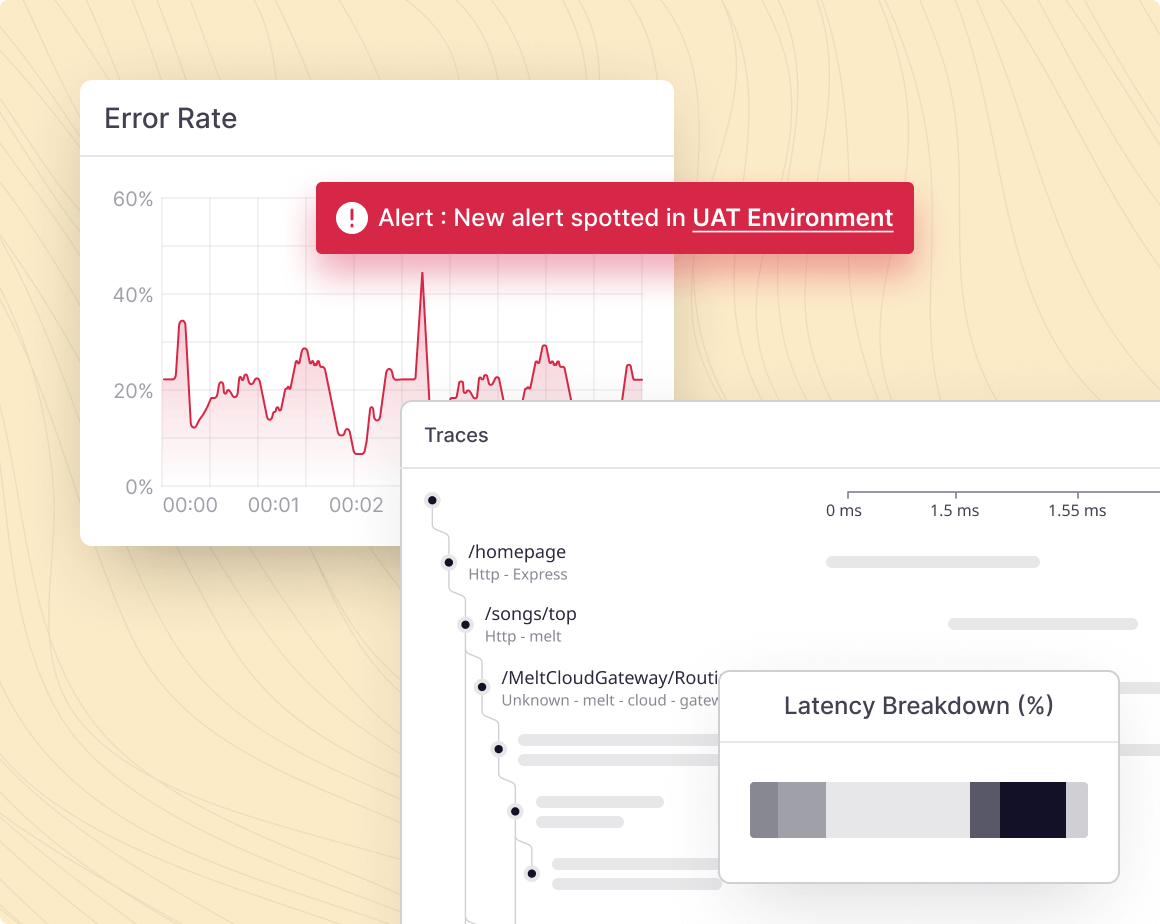
Connect the dots for full context.
Instantly find the connections between the alert and other areas of the system for root cause analysis.
Improve decision intelligence for efficient troubleshooting.
Auto detect, track and set alerts on what’s happening inside docker.
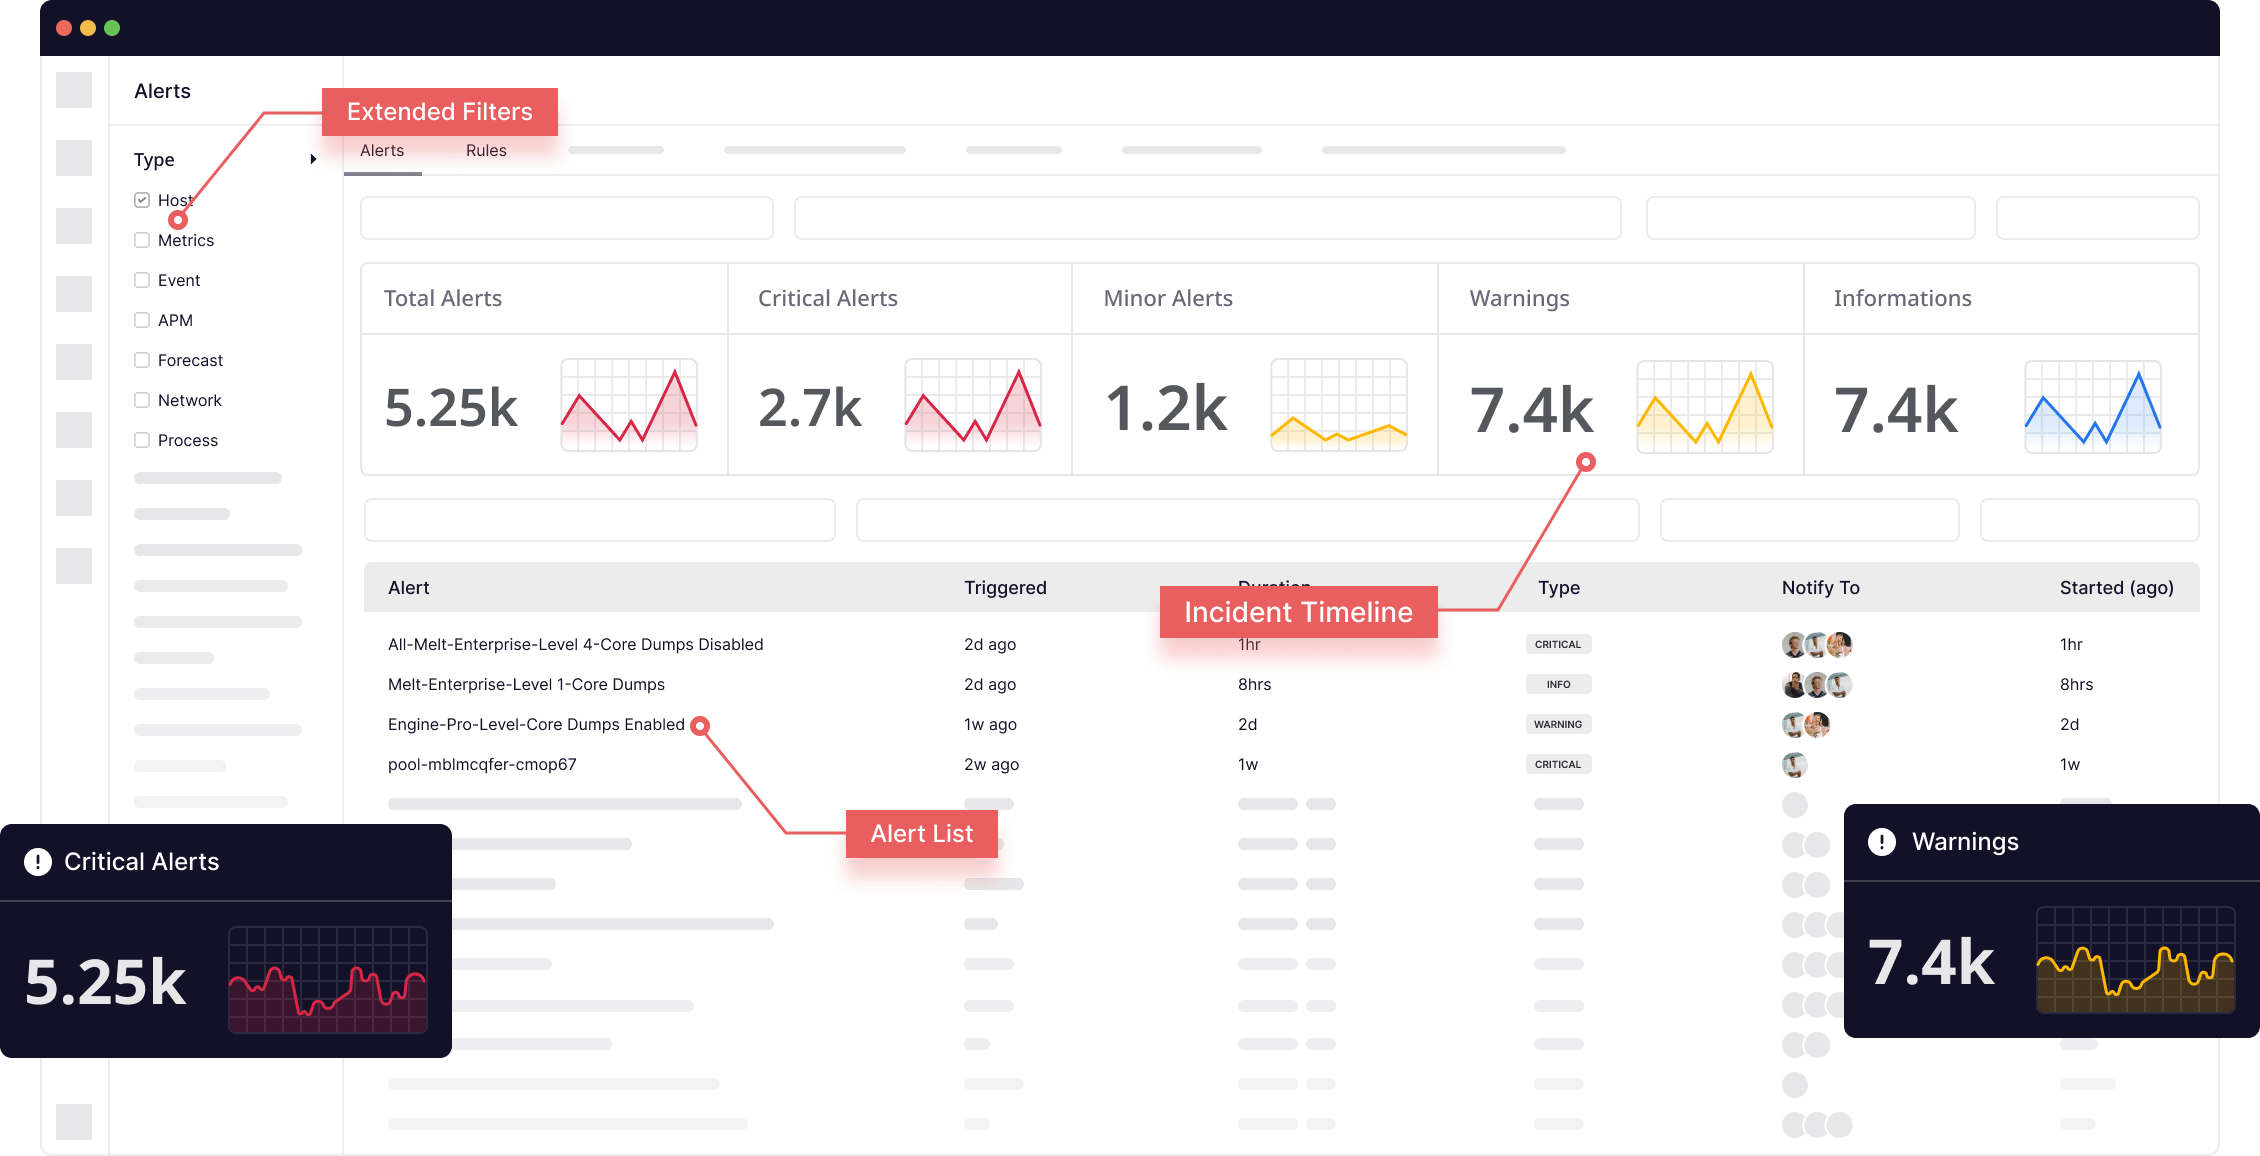
Automated alert creation & capture
Middleware makes it easy to create and apply alerts, reducing downtime and enabling broader observability.
- Use tags to create targeted alerts on hosts, containers, and serverless environments
- Automatically apply alerts to new components for efficient scalability
- Combine alerts to streamline functionality, reducing noise and alert fatigue
- Set up immediately with no implementation lag time
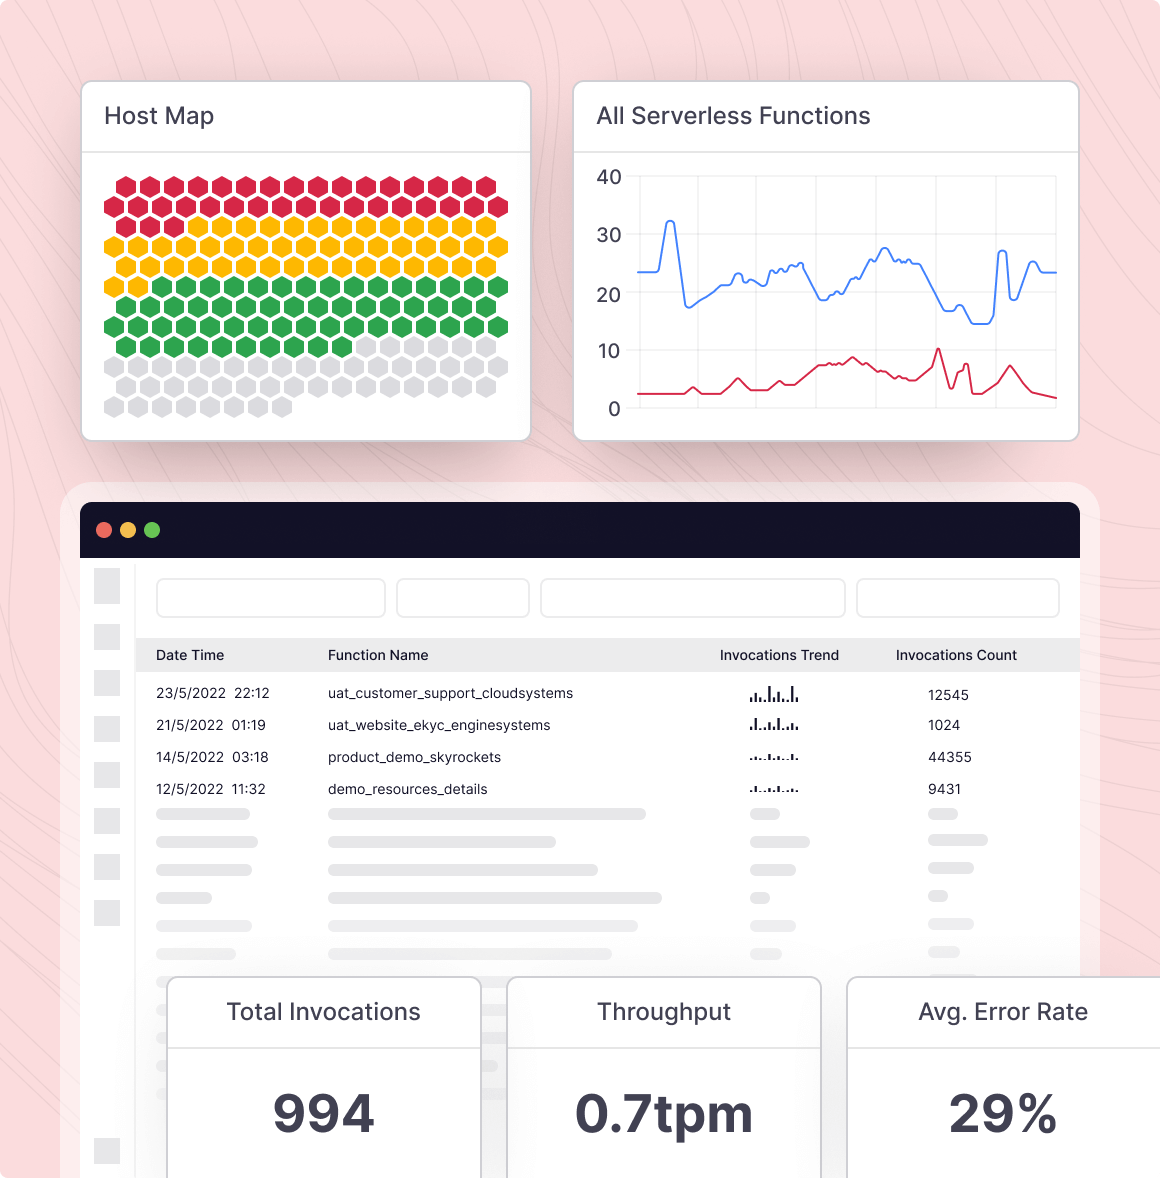
Full implementation across your entire stack
From containers to serverless environments, Middleware enables you to apply real-time alerts, then contextualize the alerts with full observability.
- Automatically detect anomalies across your entire infrastructure—hosts, containers, serverless, etc.
- Improve existing systems through custom codes to enrich your overall tech stack
- Supervise grouped analysis of anomalies, metrics, and stack traces within a surfaced issue
- Block potential erroring and bugs that slip through the cracks
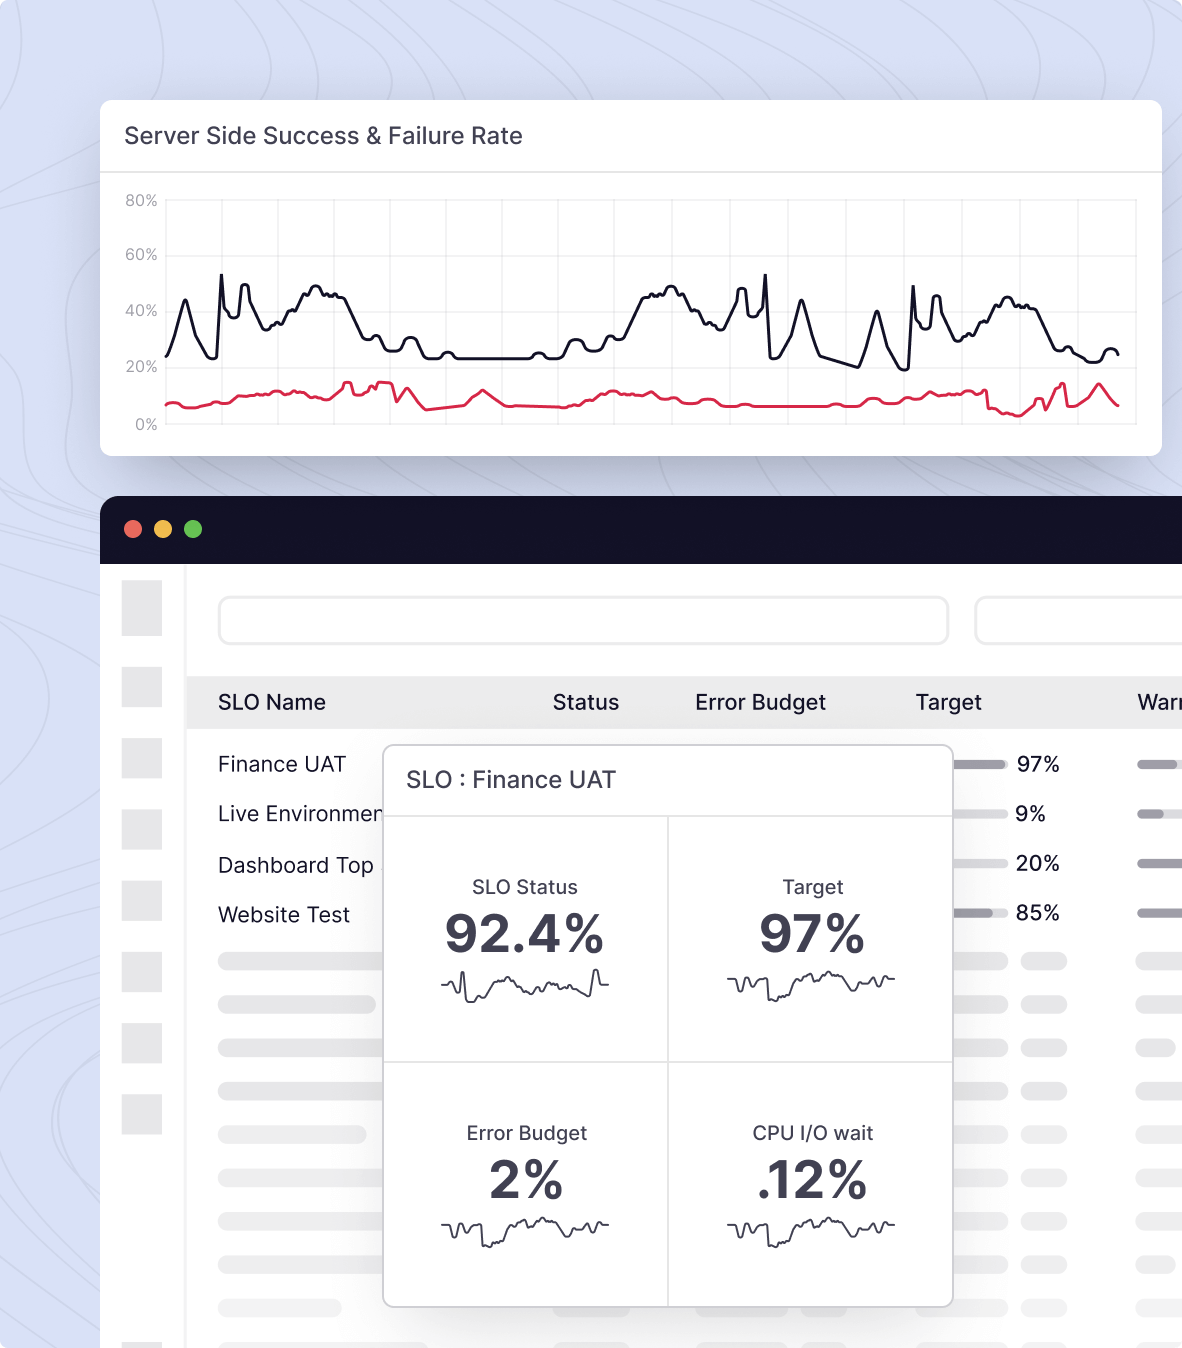
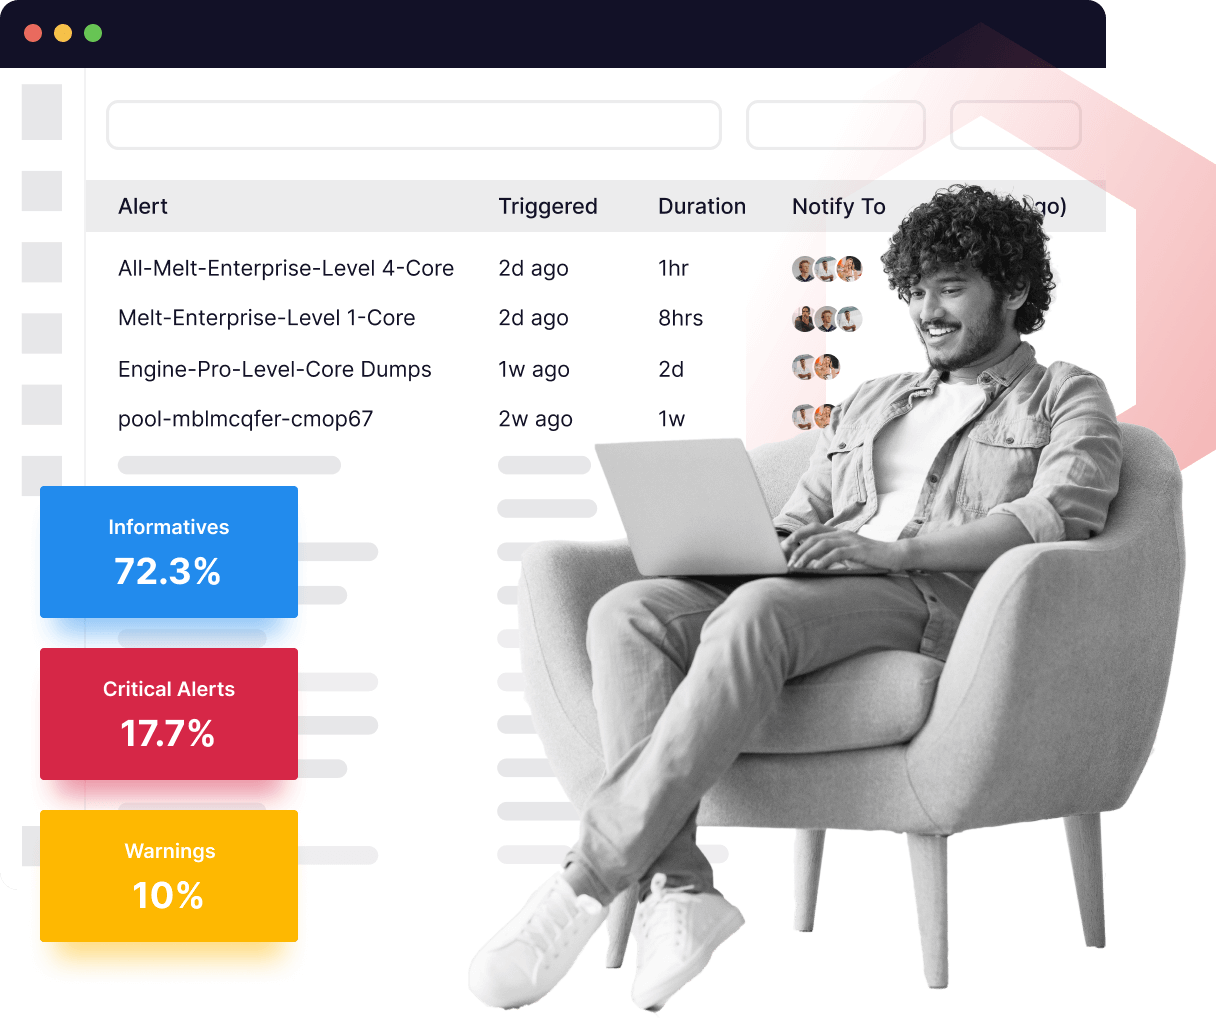
SLO and SLA tracking to ensure optimal performance
Never lose efficiency and keep all your teams aligned with automated SLO and SLA tracking, instantly addressing alerts as they arise.
- View and track critical SLOs through visualizations and dashboards
- In just a few clicks, identify which SLO targets and thresholds are at risk
- Analyze rolling error budgets to prioritize engineering efforts and confidently deploy updates
- Integrate alerts with tools like Slack, Hangouts Chat, and Microsoft Teams, and automate custom JIRA tickets
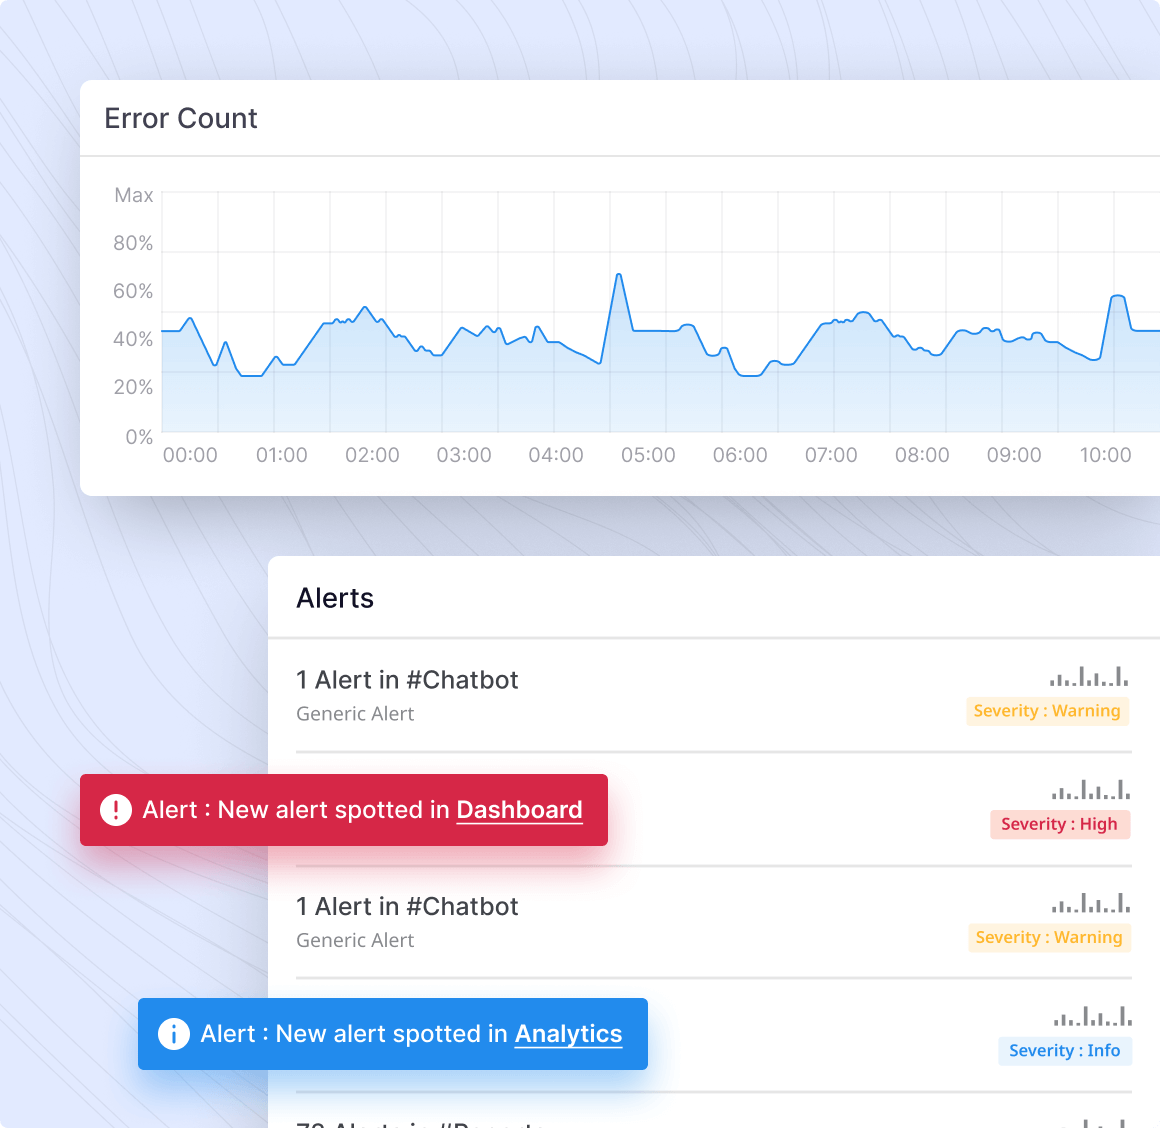
Root cause analysis for each alert
Intelligently group anomalies, metrics, and traces to identify the root cause behind surface issues.
- Unsilo your data to make more holistic connections between correlation and causation
- Understand the full impact radius of an incident for faster response
- Contextualize small errors & prevent larger ones from occurring