Log monitoring is critical for DevOps and developers as it provides insights into issues when and where it occurs. Read our detailed guide about log monitoring, its best practices, use cases, benefits and tools.
As organizations adopt more cloud-native technologies, containers, and microservices-based architectures, log monitoring and management have become crucial.
The Markets and Markets report suggested that the global log management market is expected to grow from $2.3 billion in 2021 to $4.1 billion by 2026. And this is because of rapid digital transformation and hyper flexibility of the cloud environment dominated by Amazon Web Services, Microsoft Azure, and Google Cloud Platform.
These cloud environments are good at one sight and complex at another. And this complexity in cloud architectures leads to an increase in the volume, velocity, and variety of logs. Moreover, measuring it with other observability pillars like metrics and traces becomes complex.
Your team (including DevOps, SRE and Seniors Developers) needs a more innovative way to monitor and analyze logs to identify what’s happening in these complex environments and take advantage of their operational and business value.
Therefore, in this article, we will explore what logs are and the importance of log monitoring to understand cloud architectures’ complexity, best practices, use cases and tools.
What are logs?
In computing, a log is a record of events that have occurred, usually containing a timestamp and details about the event. Logs are typically used to troubleshoot problems, monitor system performance, and detect security issues.
Software programs and systems generate log files. They contain details about the application, user device, time, IP address, and many more. There are many different types of logs, including application logs, system logs, and security logs.
Logs can be stored in various formats, including plain text files, databases, and specialized log management systems.
What is log monitoring?
Log monitoring is the process of continuously monitoring logs for specific events or patterns in order to identify potential issues or problems. DevOps and Developers continuously observe logs as they’re recorded, and further, they employ log monitoring tools to collect, examine, and comprehend network performance data.
Log monitoring is often used to ensure system stability, identify security breaches, and track changes or updates to a system. It can be used in a variety of settings, including IT departments, web servers, and cloud-based systems.
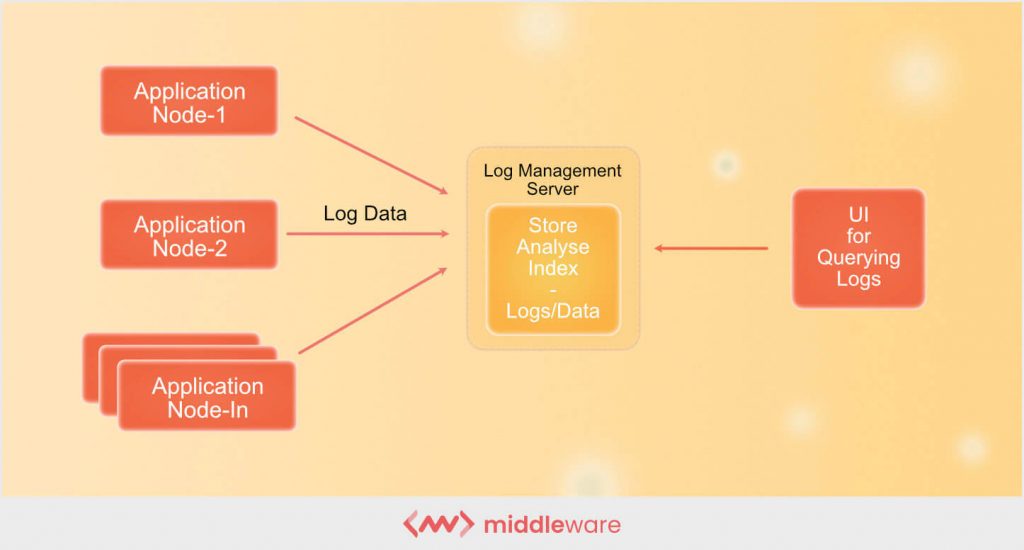
As they operate, all network components, including software and hardware, produce logs. It is a process for collecting information and alerting individuals when there is a possible problem.
- Evaluating gathered logs as they are being recorded.
- It involves aggregating log files and providing alerts or notifications for particular log messages and events.
Log monitoring use cases
Depending on the scope and techniques employed, multiple kinds of monitoring can be established. Distributed tracing may be necessary for modern cloud-native systems built using microservices to monitor the progress of a request. For all other reasons, monitoring logs, events, and metrics are still essential. Here are a few real-world use cases:
1. Cloud infrastructure monitoring
Cloud monitoring examines, monitors, and manages an IT infrastructure’s operating procedures. Manual or automated management procedures confirm the performance and availability of websites, servers, apps, and other cloud infrastructure. This ongoing assessment of resource usage, server response times, and speed identifies potential vulnerabilities to problems before they materialize.
Making the most of your cloud-based resources is possible with cloud log monitoring. Most contemporary log monitoring tools can collect various logs and data from different sources.
It can track things like:
- Host and Virtual Machine,
- Container platforms,
- Integration of third-party,
- Resources, networks, Device info and a lot more.
Here are a few benefits of cloud monitoring:
- Scaling for increasing activity is simple and effective in businesses of all sizes.
- The host maintains certain tools (and hardware).
- Tools may be used on a variety of devices, such as smartphones, tablets, and desktop computers, allowing your company to monitor apps from anywhere.
- Infrastructure and settings are already in place, making installation straightforward.
2. Monitoring application performance
Many businesses use distributed tracing and monitoring (metrics) to monitor their applications. Logs are the most acceptable source for connecting the dots throughout an application stack for troubleshooting or debugging programs.
- It is beneficial to spot issues before they affect actual consumers.
- Monitoring app components, like- servers, databases, and a lot more.
- It offers alerts and a dashboard to remove application bottlenecks.
3. Network monitoring: identifying system issues
Enterprise networks are built on hardware like load balancers, routers, and firewalls. Monitoring and tracking network errors might assist you in making sure that these devices are operating correctly. Additionally, it helps create secure communications, auditing, and fixing network issues.
4. Web server monitoring by debugging
Log monitoring is essential to offer a better user experience whether your company website or application is hosted by Apache, IIS, or any other web server. Server logs may monitor traffic volume, issues, failed services, and more. You can improve your online applications, spot spikes in traffic, and solve problems more quickly by keeping an eye on web server logs.
Why do we need log monitoring?
The notions of log monitoring and log analytics are interrelated yet distinct from one another. Together, they ensure that apps and critical services are in good shape and running at their best.
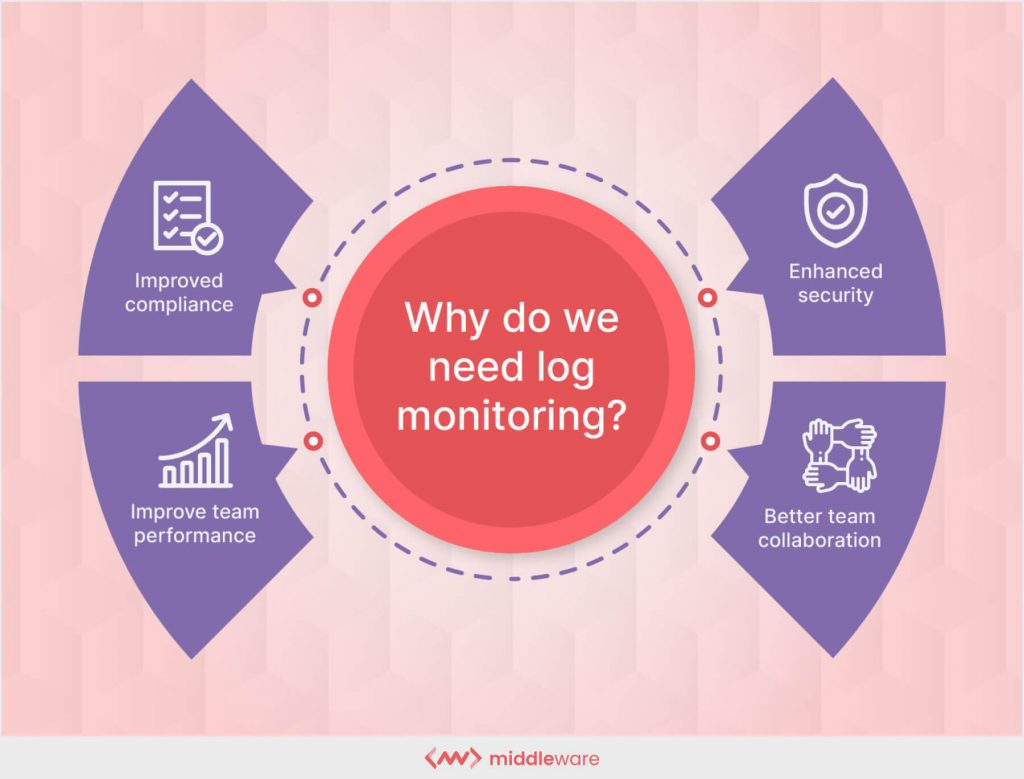
Here are a few benefits of log monitoring:
Improved compliance
Many government and regulatory bodies demand that businesses follow the law and provide evidence of compliance. Log monitoring can assist companies in adhering to various laws and regulations, including GDPR, HIPAA, PCI, and many more. In addition, logs provide a cost-effective means of complying with critical regulatory requirements.
Common activities tracked consist of:
- Login attempts to the account
- Aspects of account management
- Access to directory services
- System activities
- Alterations to policy
Enhanced security
Programs and apps are the targets of several cyberattacks. Monitoring logs enable businesses to identify code weaknesses and take preemptive measures to boost program performance.
- Identifying weak performance areas.
- Debugging and evaluating the health of an application.
- Detecting and locating the source of installation and run-time issues in applications.
Improve team performance
Through log monitoring, teams can optimize system performance by identifying possible blockages and ineffective setups.
- System health is being monitored in real-time for irregularities or inactivity.
- Detecting problems with performance or settings.
- Observe operational goals and SLAs.
Create a better team collaboration
Cloud operators and architects gain from a single log monitoring solution to build more dependable multi-cloud setups.
- Teams can better react to events rapidly and identify issues before they affect end users.
- Aids in effective collaboration between stakeholders to address any issue.
What are the best practices for log monitoring
Following recommended best practices during log monitoring is advisable to overcome these difficulties.
1. Use of structured logging
Analyzing log files can be tricky since they often include unstructured text data. While you can use contemporary technologies to examine both structured and unstructured logs, doing so can be time-consuming and frequently error-prone. Therefore, it is good to use standard structured methods for logging.
2. Add labels or special identifications.
Tagging logs may be helpful when troubleshooting or debugging programs since they make it easier to segment and filter the records. You can use unique string values to narrow the search. When examining logs in container systems, tags become even more crucial.
3. Real-time monitoring
Real-time monitoring will aid in the prompt resolution of any breaches or difficulties that occur in a live environment. In addition, live monitoring helps you spot issues as they develop and address them before they become major.
4. Setting up alerts
Since IT staff frequently handle several tasks, it’s not always possible to keep an eye on everything constantly. However, establishing baselines for your various monitoring metrics and configuring alerts for changes from these baselines can help you remain on top of your surroundings.
5. Improve policy for log retention
Depending on their specific requirements and conditions, businesses should establish distinct retention rules for various log kinds.
In some circumstances, keeping records for a long time is necessary to abide with local data protection laws. Additionally, you might wish to save some logs for longer than the typical 90 days in order to facilitate a longer-term study of application performance or user activity.
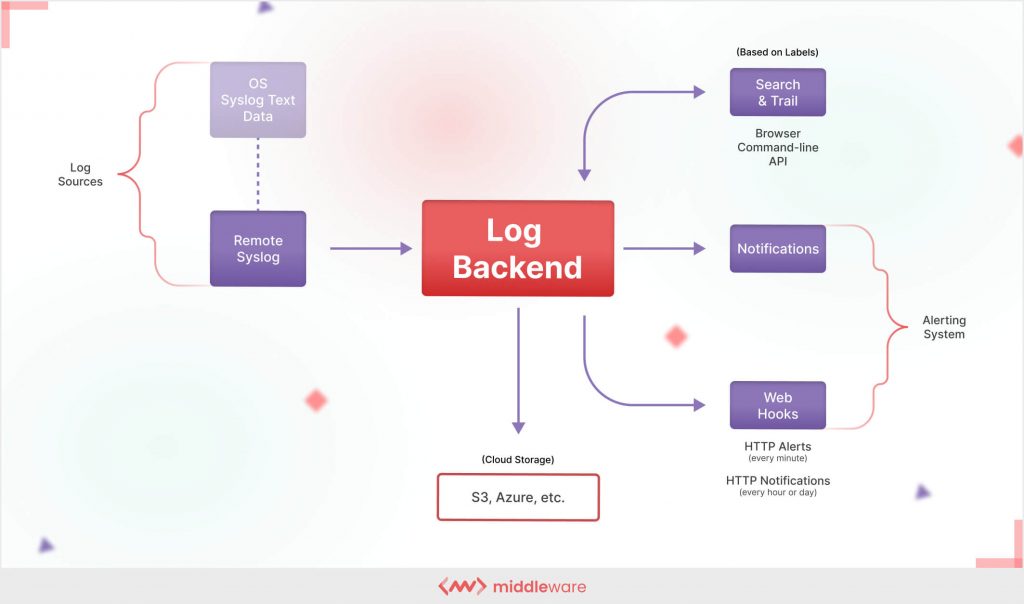
6. Organize and aggregate your log data
Log data is produced at several locations across the IT infrastructure, but it must be collected in one place before it can be properly used for data analysis. Tools should automatically ingest such logs as they are produced by IT systems and send them out of the production environment and into a centralized place.
How to choose the best log monitoring tools?
Each business may have unique logging needs based on log volume, scalability, compliance, or log retention. These are the essential things to think about:
Privacy and Compliance
Privacy compliance refers to an organization’s need to use caution while managing the sensitive data that it receives on a daily basis. It is a procedure that enables businesses or organizations to adhere to both commercial and regulatory requirements for the preservation and management of data.
HIPAA has strict standards for log management and audits.
- What confidential data is being modified or exchanged?
- who had access to what data when
- logins for employees
- Updates to software and security
- both system and user activities
- Unusual use trends
Log volume and retention
Determine your daily volume and take data spikes and unusual behavior into consideration. Determine whether your use cases are for the live tail and real-time debugging or whether you must retain logs for compliance, as well as how long to store the data.
Cost & Scalability
The cost will play a significant role in the decision-making process. Pay per gig is one of the most adaptable and wisest uses of a logging platform. Depending on your product, you may go from processing a few thousand logs a day to a few millions overnight. Here is a helpful checklist for calculating your overall operating costs and the features you’ll want from a log management platform.
- Free trial
- Available free plan with live tail
- Tracking log volume storage retention expenses
- Limits for users and what to do if they are exceeded
- Features available for every plan
What are the best log monitoring tools
1. Middleware
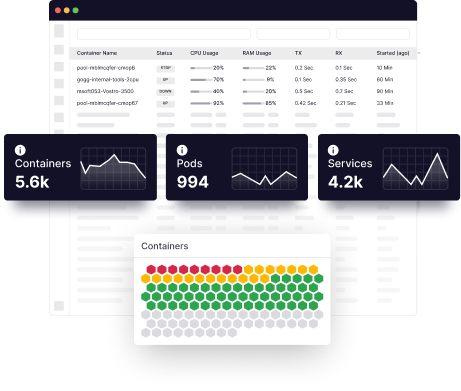
Middleware is a full-stack observability platform that gives you complete transparency and analysis of your entire tech stack. This log monitoring tool offers a cost-effective approach to centralized log management.
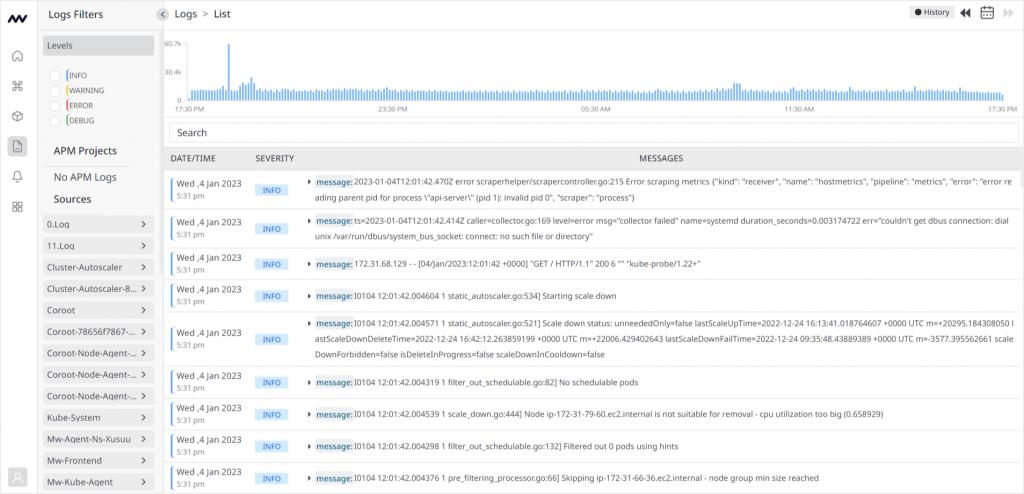
With Middleware, get real-time, prescriptive answers to problems & optimize resources by identifying root causes.
- Summarize log activity in a single interactive dashboard so you can spot potential issues as they pop up
- Create an efficient platform to monitor and analyze logs from several sources.
- Manage logs that fit into your organizational structure, regardless of the role.
- Get search results in a matter of seconds with all your data on one platform. Even further, select logs in a particular timeline.
- Investigate potential threats using alerts when an issue occurs.
- Diagnose issues in real time.
- Supports various open-source log data frameworks.
Pricing
- Free with limited usage
- Almost 5x less cost than other competitors
- Custom pricing for enterprise edition
- Best price in the segment
2. Dynatrace
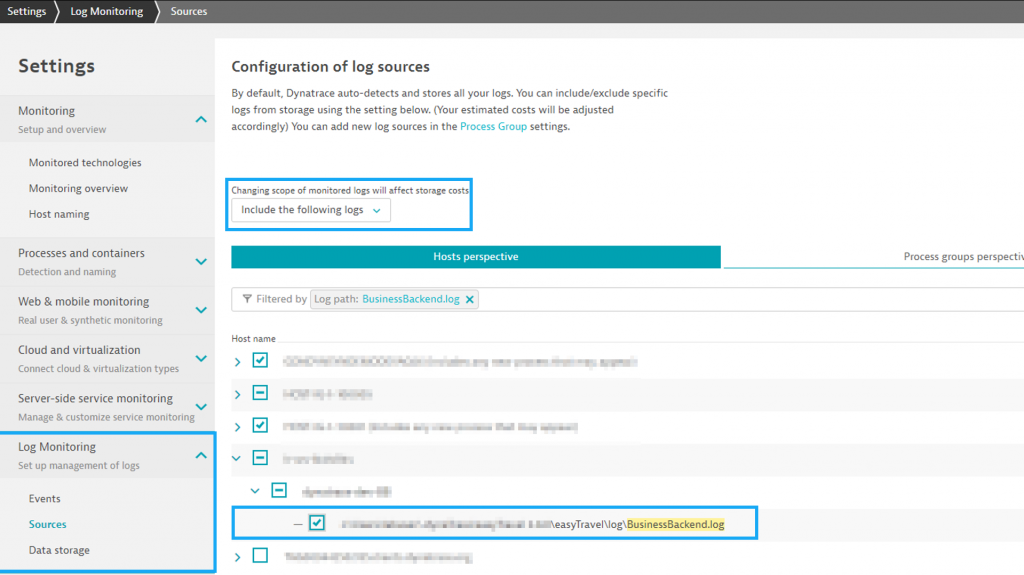
For better AI-powered full-stack observability that produces results and continuous automation, it combines logs with other data sources such as metrics, traces, and actual user data, all in context with dependency mapping.
- Enterprise-scale Dynatrace automatically gathers log and event data from a wide range of technologies in hybrid and multi-cloud settings.
- Supports multi-cloud systems natively, including Red Hat OpenShift, Microsoft Azure, Google Cloud Platform, and AWS.
- Support various open-source log data frameworks
Pricing
- Basic Starts from $11 per month
- Full stack monitoring – 74$ Per month
- Pay as you go for the enterprise edition
3. Newrelic
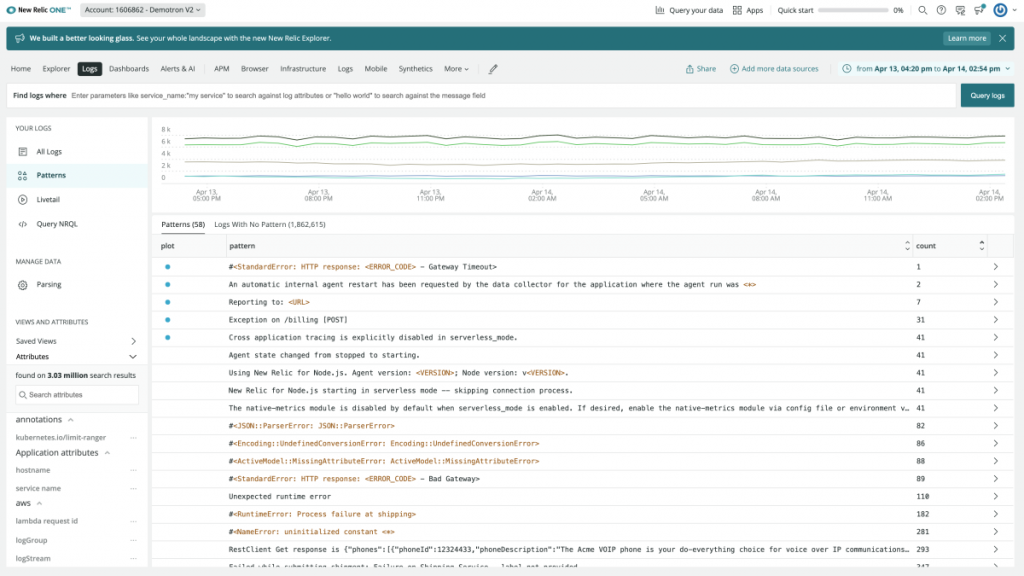
Relic offers a single platform for all telemetry data, including metrics, events, logs, and traces, along with analytical tools for quick problem-solving. Discover the “why” by looking past the “what.”
- Log management in New Relic automatically adjusts to the volume you utilize. Rates for data and users won’t rise. As a result, you will constantly be aware of the price.
- Get search results in a matter of seconds with all of your data on one platform. After that, utilize data partitioning to divide up the data any way you choose.
- Ingest text-based data from anywhere with ease. Pick the New Relic log forwarder that works best in your environment, then deploy it.
Pricing
- Free with limited features
- Custom based pricing for Pro and Enterprise edition
4. Sentry
Sentry is an event logging platform whose main goal is to gather and record exceptions. It was first designed at DISQUS in the early months of 2010 to address the issue of exception logging in a Django application.
Since then, Sentry has expanded to support a variety of well-known programming languages and operating systems, including Python, PHP, Java, Ruby, and Node.
- With stack traces, Sentry improves application performance monitoring.
- To identify the precise, underperforming API call and reveal any associated problems, examine the entire end-to-end distributed trace.
- Whether you’re using JavaScript, PHP, or something in between, Releases provide you visibility into which mistakes were fixed and which were made worse.
Pricing
- Free with limited features
- Team – $26/mo
- Business – $80/mo
- Custom pricing for enterprise edition
5. LogDNA/ Mezmo
Mezmo’s intuitive log management platform unleashes the potential of log data. Data must be ingested, normalized, and routed to DevOps, IT Ops, and development teams so they can respond quickly and effectively.
- You can comprehend and control data spikes with the aid of use quotas and index rate alerting.
- Receive notifications for specific searches, correlations, and storage criteria.
- Users can arrange data to make it more usable with the help of auto & custom parsing and enrichment.
Pricing
- Free with limited features
- Professional – $0.80/GB
- Enterprise – CUSTOM
6. GoAccess
GoAccess is a real-time log analyzer program that can be used with either a browser or a Unix terminal. It offers an immediate logging environment where information can be viewed milliseconds after it has been saved on the server.
- Completely Real Time
- Application Response Time Monitoring
- Incremental Log Processing
- Minimal configuration needed
Pricing
- Open-source
7. Graylog
Graylog enables you to adhere to compliance regulations and aids in determining the root cause of any specific mistake or issue your apps may be encountering. In addition, large and complicated IT infrastructures may be monitored with the help of this powerful technology.
- Personalized dashboards for query and log data visual output.
- Team members have access to centralized management.
- Individualized permission control for users and their roles.
- Personalized triggers and notifications to track any data problems.
Pricing
- Open-source
- Enterprise: $6,000/year
8. Splunk
The software from Splunk is designed to enable the process of indexing and interpreting logs of any kind, including complex application logs and advanced unstructured logs, using a multi-line approach.
- Maintain your flexibility and agility to generate high performance and succeed in the cloud.
- System for monitoring and alerting users to significant activities and events.
- Real-time data search and analysis with a flexible user interface.
Pricing
- Free- 500MB/per day
- 185$+, for the cloud version.
- 2000$+, for the enterprise edition.
9. Datadog
Datadog is a SaaS-based software for monitoring cloud applications. With the aid of the tool Datadog, you may keep an eye on serverless operations, system activities, Windows and Linux hosts, and cloud-based software. It may be used to manage logs, investigate metrics, and display data, among other things.
- Create shareable, real-time dashboards that include metrics and distributed traces together with log visualization and monitoring.
- Receive notifications when you go beyond user-defined log monitoring thresholds for a certain amount of time to spot problems like build job notifications or code exception failures.
- Utilize 500+ technology integrations to create unique pipelines that rapidly process and enrich logs.
Pricing
- Free
- Pro – $15
- Enterprise- $23
Log monitoring challenges
In current workplaces, it may rapidly become daunting to translate the deluge of incoming logs and data into compelling use cases. Although log monitoring is crucial to IT operations, doing it successfully in cloud-native settings presents certain difficulties.
- Distributed systems produce a large volume of logs to store, query, and manage, whether built on the classic server/client architecture, containers, or cloud services. For this, you might need a tool that helps you collect logs efficiently.
- Real-time monitoring is required for efficient monitoring. To undertake a quick troubleshooting procedure, teams must be able to be efficiently informed when an application fails.
Sometimes it provides a less user-friendly interface, leading to issues, oversights, and human error.
How Middleware unlocks the value of log monitoring
Log monitoring is crucial for determining the present performance of your system, keeping it functional, and increasing its effectiveness. You can correctly monitor log events and optimize log monitoring with log monitoring software.
Although log monitoring is critical to enhancing your understanding of your performance, making informed decisions, and optimizing functionality, it is not as easy as it sounds. It can be challenging to efficiently, accurately, and reliably monitor thousands of logs in real-time.
Middleware platform makes log monitoring easy, reliable, and cost-effective. With it, you can easily monitor and analyze infrastructure and front and back-end logs from a single place.
You also have greater control over the health and performance of your infrastructure with a unified, centralized dashboard. Get more excellent reliability, scalability, support, and visualization.
Get in touch with our experts to know how our expertise in delivering real-time observability of logs can help you enhance your application’s security, compliance and performance.
1) Why is monitoring logs important?
Both logging and monitoring are important components of ensuring optimal application performance. Using a combination of logging tools and real-time monitoring systems improves observability and decreases the amount of time spent sifting through log files to determine the root cause of performance issues.
2) What are the three different kinds of logs?
Availability logs are used to monitor system performance, uptime, and availability. Resource Logs: These logs contain information about connectivity issues and capacity limits. Threat logs: contain information about system, file, or application traffic that matches a firewall’s predefined security profile.
3) What is monitor logs and Analytics?
Log Analytics is a tool in the Azure portal that allows you to edit and run log queries from Azure Monitor log data and interactively analyse the results. Log Analytics queries can be used to retrieve records that meet specific criteria, identify trends, analyse patterns, and provide various insights into your data.
4) What language does Log Analytics use?
Log Analytics allows you to write queries in its own query language called Kusto. Then you can run your queries and do all sorts of interesting things with the results.