What is observability exactly? Observability provides complete visibility into distributed systems so you can quickly identify & fix problems. This guide covers everything from the basics to more advanced concepts and shows you how it works in detail. Learn more here.
Observability has been gaining a lot of attention over the last few years. It has been a buzzword after an increasing number of companies moving to microservice-based architectures, yet with the added complexity of coordinating those microservices, organizations find it more difficult to monitor and troubleshoot in and after production.
Even more challenging as distributed system architecture becomes more complex, tracking and responding to issues in multi-cloud environments. For IT, operations, QA, and SRE teams, observability provides a helpful solution to gainfull visibility into each component of their diverse and complex systems.
Manual processes and traditional troubleshooting methods just don’t cut it anymore.
According to recent data, 78% of technology professionals say that observability is a key enabler for achieving core business goals.
NewRelic Research
But what is observability, exactly? How does it work? What are its challenges? And most importantly, why is it important for your organization? This article will address all these questions and more.
What is observability?
Observability is the ability to measure a system’s current state based on the data it generates. It provides a thorough understanding of this system by examining all the inputs at your disposal.
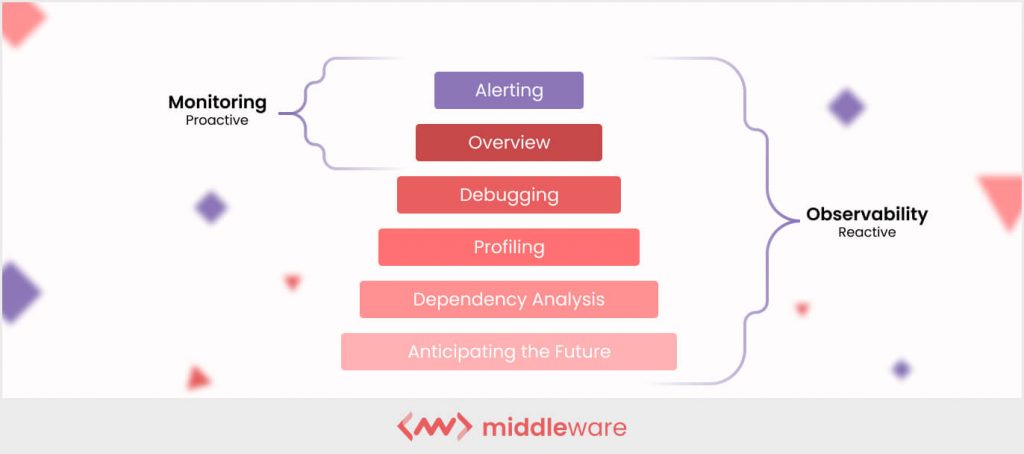
The term observability is rooted in control theory, which is how engineers infer the internal states of a system from its external outputs. This is why observability and monitoring, though related, are two different concepts.
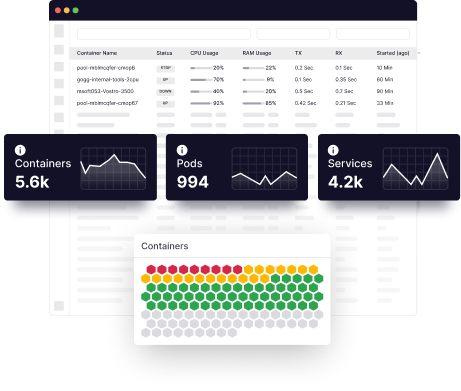
Most cloud monitoring solutions use dashboards to display performance indicators so IT teams can find and fix problems. However, because these dashboards are internally generated, they only indicate performance irregularities or concerns your team has anticipated.
As such, monitoring platforms can’t effectively monitor complex cloud-native apps and containerized environments where security threats are multi-faceted and unpredictable.
Observability is the best solution here. By using logs, traces, and metrics gathered from your entire infrastructure, observability platforms provide actionable insights into system health, identifying flaws or weak attack vectors at the first sign of an error. In most cases, observability tools can alert DevOps engineers of potential problems before they even arise.
With observability, you can access information like system speed, connectivity, downtime, bottlenecks, and more. This empowers your team to reduce response times and maintain long-term system health.
Read more about Observability v/s. Monitoring
Why do we need observability? Learn some benefits
Now that you have an idea of what observability is, how does it help your organization? In a sentence, observability gives you more control over complex systems.
Because they have fewer moving parts, simple systems are easier to handle. Monitoring CPU, memory, databases, and network conditions are enough to understand simple systems and apply the right solution to a problem.
Distributed and complex systems, on the other hand, have so many interconnected parts that the number and type of errors are much more significant. In addition, distributed systems update regularly, and each change can introduce a new type of bug. Complex systems create more “unknown unknowns.”
Observability is key to identifying these “unknown unknowns.” When you do, here are some key benefits that will arise.
1. Make sense of complex & diverse inputs
Observability gives engineering teams a complete view of their architecture. This makes it easier for teams to understand data in a complex system, from third-party apps and APIs to distributed services.
2. Speed up troubleshooting
Observability empowers IT teams to spot hard-to-detect issues, which improves troubleshooting time and reduces Mean Time to Identify (MTTI), Mean Time to Acknowledge (MTTA) and Mean Time to Restore (MTTR)—all key objectives for the modern SRE.
3. Increase team productivity
By quickly and accurately identifying errors, observability enables developers to spend more time-solving problems than finding them. It also reduces alert fatigue, one of the biggest productivity killers.
4. Improve the user experience
With improved error detection and speeding up the troubleshooting process, observability systems achieve high system availability and reduce downtime. This provides an excellent user experience and builds customer confidence and loyalty.
5. Reduce time to market
Observability also enables you to lay your cloud infrastructure’s foundation by integrating complex systems and comparing external states. This approach to integration ultimately shortens the product’s time to market.
6. Analyze real-time business impact
By combining context with full-stack application analytics and performance, businesses can see applications’ direct impact on key business metrics and verify that all teams are abiding by internal and external SLAs.
How does observability work?
Observability works on three pillars: logs, metrics, and traces. By continuously identifying and gathering these three types of data, observability platforms can correlate them in real-time to give your entire organization—from DevOps to SRE to IT and more—comprehensive, contextual information.
In short, observability platforms turn the what into a why. Armed with this information, your teams can identify and fix problems in real-time.
Different observability platforms will do this in different ways. Some search for new telemetry sources that may be present in the system (such as a recent API call to another software application). Others also feature AIOps (artificial intelligence for operations) capabilities that separate the signals—indicators of real problems—from noise because they deal with much more data than a traditional APM solution.
However, observability centers around these three pillars no matter what type of platform you use. The three key pillars of observability are logs, metrics, and traces.
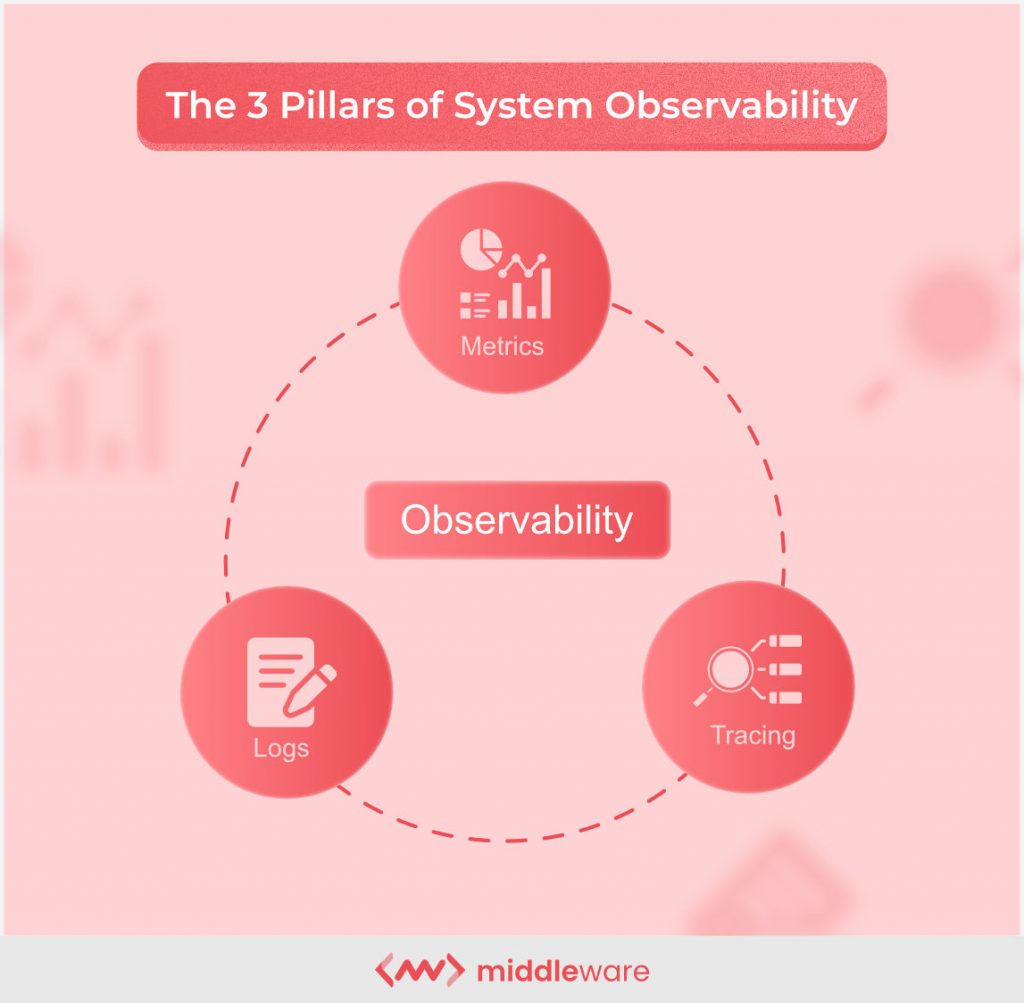
Logs
Logs are immutable, timestamped records of discrete events that happened over a set time frame within an application. Developers can use logs to uncover emergent and unpredictable behaviors within each component in a microservices architecture.
There are three types of logs:
- Plain text: A log record can be free text. This is also the most popular log format.
- Structured: This type sends logs in JSON format.
- Binary: Protobuf logs, MySQL BinLogs for replication and point-in-time recovery, Systemd journal logs, and the PFLOG format used by the BSD firewall pf are frequently used as a backup system.
Every component of a cloud-native application emits one of these log types. This can lead to a lot of noise. Observability takes these data and converts them into actionable information.
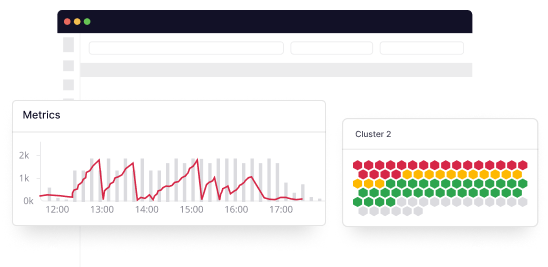
Metrics
Metrics are the numerical values that represent and describe the overall behavior of a service or component measured over time. Examples include timestamps, names, and values. Because they are structured by default, they’re easy to query and optimize for storage.
Metrics save time because they can easily correlate across infrastructure components to provide a comprehensive picture of system health and performance. They also enable quicker data search and advanced data preservation.
However, metrics do have limits. When triggered, they can indicate when maximum or minimum thresholds are reached, not why the issue occurred or what the user experiences on the front end. Those insights require additional pillars of observability.
Traces
While logs and metrics evaluate individual system behavior and performance, they’re rarely useful in determining a request’s lifecycle in a distributed system. Tracing provides an additional method to this context.
If metrics tell you that an issue is occurring, traces help you investigate the precise service causing the issue, enabling developers and engineers to identify and fix the root cause quickly.
Through traces, engineers can analyze request flow and understand the entire lifecycle of a request in a distributed application, as each operation is encoded with critical data related to the microservices performing that operation.
Traces can help you assess overall system health, identify bottlenecks, spot and fix problems faster, and select valuable areas for tweaks and improvements.
Challenges of observability
While observability is a powerful tool for modern, cloud-native architecture, it’s not without its limitations. Some of these include:
- Dynamic, multi-cloud environments are increasingly complex, and many legacy observability platforms have a hard time keeping up
- Data and alert volume, velocity, and variety can mean that signals get lost among the noise, as well as create alert fatigue.
- Siloed infra, dev, ops, and business teams cause many key insights to become lost or come to the surface too late.
- Connecting correlation to causations, realizing which actions, features, apps, and experiences drive business impact
It’s important to understand the challenges that modern observability platforms face; that way, you have clear expectations of what to expect going in.
What does observability look like for microservices?
As organizations rapidly adopt microservices-based architecture for their applications, observability platforms and processes need to adapt their approaches to keep up. Two major forces have contributed to this next evolution in observability:
- Cloud computing. As serverless and Lambda functions increase in popularity, organizations are able to scale faster than ever.
- Containerization. Docker, Kubernetes, and other container technologies make it easy to spin up new services and scale them on demand.
So what does observability mean for distributed systems and applications based on microservices? That’s where the challenge arises.
Because it’s impossible to predict all states of a system, identifying root causes becomes a bigger challenge. It requires a massive amount of data and the systems necessary to turn said data into actionable information to gain the full picture.
In microservices observability, tracing plays a much more prominent role. With distributed tracing, you can ask the following questions:
- How much time did the request take to traverse each microservice?
- What is the sequence of calls that were made during a user request?
- What did each microservice do to complete a request?
- Which component was the performance bottleneck?
- What was the deviation from the normal behavior of the system?
Distributed tracing reconstructs the whole execution path of a user request, passing a context object along said path. As context propagates, the system can correlate events into a sequential flow that depicts causal relationships.
Two data points are critical for this to work:
- Time is taken by a user request to traverse each component of the microservices application
- The sequential flow of the request from start to end
These data make it possible to identify bottlenecks and trace issues back to their root causes.
But how exactly is distributed tracing different from logging? A key way to remember is this: logging focuses on what happens within an individual application while tracing works to connect the dots among various microservices applications.
An engineer can use distributed tracing to pinpoint the source of an error. Then, once they’ve identified that source, they can use logs to dive into what happened and how to fix it.
Together, distributed tracing and logs result in faster resolution and reduced downtime—even among microservices-based applications.
What to look for in an observability tool
A number of factors go into play when choosing an observability platform: capabilities, data volume, degree of transparency, and corporate goals.
Neither the most expensive nor the cheapest option is the best one. It’s all about finding the best fit for your organizational needs.
1. User-friendly interface
Dashboards provide a clear picture of system health and errors in an easy-to-digest way. at different levels in a system. Since your solution will affect many people in the company, it should be user-friendly and easy to implement. Otherwise, it won’t fit into your established procedures, and key stakeholders will quickly lose interest.
2. Real-time data
Gathering real-time data is critical, as stale data complicates determining the best course of action. Therefore, you should use current event-handling techniques and APIs to collect real-time data and put everything in perspective. You won’t know about the data if you don’t have it.
3. Open-source compatibility
When choosing an observability tool, it’s important to consider how it retrieves and processes data about your environment.
It’s advisable to use an observability tool that uses open-source agents to fetch and process data in two ways. This both reduces your system’s CPU and memory consumption and offers appropriate security and easier configuration than agents developed internally.
4. Easy to implement
It’s not enough to purchase observability software. You also have to put it to use. Finding a platform that’s easy to implement—ideally with a support team and knowledgebase—is key to maximizing its value.
5. Integrations
Equally important is finding an observability platform that works with your current stack. Ensure that the platform supports your environment’s frameworks and languages, container platform, messaging platform, and other important software.
6. Clear business value
Some observability platforms are better than others at certain tasks. Ensure you benchmark your observability tool against key business performance indicators (KPIs) like deployment time, system stability, and customer satisfaction.
Top 5 observability platforms
Once you have a clear idea of your organizational observability goals, you can compare various observability platforms against those goals. Here are the top five to consider.
1. Middleware
Middleware is a cloud-native observability platform that will help you un-silo your data and insights from all your containers. Our platform empowers you to identify root causes, solve issues in real-time, and get the best value for money.
Bring all your metrics, logs, and traces into a single timeline, and empower your developers and DevOps to debug and fix the issue faster—reducing downtime and improving the user experience. The tool also comes with a unified dashboard that displays all core and essential services in one place.
2. Splunk
Splunk is a sophisticated analytics system that correlates and applies machine learning to data to enable predictive, real-time performance monitoring and a fully integrated IT management solution. It allows teams to detect, respond to, and resolve events in one place.
3. Datadog
Datadog is a cloud monitoring tool for IT, development, and operations teams that want to transform the massive amounts of data created by their applications, tools, and services into actionable intelligence. Companies of all sizes use Datadog across a variety of industries.
4. Dynatrace
Dynatrace is a cloud-based, on-premises, hybrid application and SaaS monitoring platform. It provides continuous APM self-learning and predictive alerts for proactive issue resolution using AI-assisted algorithms. Dynatrace offers an easy-to-use interface with a wide range of products to generate detailed monthly reports on app performance and SLAs.
5. Observe, Inc.
Observe is a SaaS Observability tool. It provides a dashboard that shows you applications’ top issues and the system’s overall health. Since it’s a cloud-based platform, it’s fully elastic. Observe uses open-source agents to collect and process data, so the setup process is relatively quick and easy.
Final thoughts on observability
The value of observability comes from its organizational impact. When engineers and developers can spot issues in real-time, trace them to the root cause, and fix them quickly, the results are less downtime, better experiences, and happier users and customers.
As systems become exponentially more complex, it’s important to have an observability platform that can keep up: managing cloud-native environments, dynamic microservices and containers, and distributed systems. Modern observability takes an otherwise complex and often cryptic infrastructure and makes it accessible—not only to engineers but to all interested stakeholders.
To learn more about the specific observability benefits that Middleware offers, click here.
FAQs
What is observability?
Observability is the ability to monitor a system’s current state based on the data it produces, such as logs, metrics, and traces. Or in other words, observability refers to its ability to discern internal states by looking at the output over a finite period. It uses telemetry data from instrumenting endpoints and services in your distributed systems.
Why is observability important?
Observability is important because it gives you greater control and complete visibility over complex distributed systems. Simple systems have fewer moving parts, making them easier to manage. But in complex distributed systems, you need to monitor CPU, logs, traces, memory, databases and networking conditions to understand these systems and apply the appropriate fix to a problem.
What are the three pillars of observability?
The 3 pillars of observability: Logs, metrics and traces.
Logs: These give you the necessary insights into raw system information to determine what happens to your database. An event log is a time-stamped, immutable record of discrete events over a period.
Metrics: Metrics are numerical representations of data that can identify the overall behavior of a service or component over time. Metrics comprise properties such as name, value, label, and timestamp that convey data about SLAs, SLOs, and SLIs.
Traces: A trace shows the complete path of a request or action through a distributed system’s nodes. Traces help you profile and monitor systems, especially containerized applications, serverless, and microservices architectures.
How do I implement observability?
Your systems and apps need proper tooling to collect the appropriate telemetry data to achieve observability. You use open-source software or a commercial observability solution to make an observable system by building your own tools. Typically, four components are involved in implementing observability: logs, traces, metrics and events.