This article explains Kubernetes monitoring from root-level. It covers K8s monitoring methods, its importance, key metrics, best practices and more!
DevOps engineers and developers need orchestration tools to help efficiently and automatically manage the various containers that make up their applications. Kubernetes is a modern and emerging solution to this need. Kubernetes is not the only container management tool, but it has overtaken the ecosystem because it allows one to create and deploy multiple containers without hutches.
Although Kubernetes eases the production workload for developers, it equally requires regular monitoring for efficiency. Monitoring Kubernetes is, however, a challenge because of the vastness of the Kubernetes architecture. This article explains the intricacies of Kubernetes monitoring, highlighting important Kubernetes metrics to collect and best practices you can implement to monitor your containers effectively.
What is Kubernetes?
Designed by Google and later donated to the Cloud Native Computing Foundation (CNCF), Kubernetes (also called ‘K8s’) is an open-source orchestration tool for managing the clusters of containerized applications, providing OS-like services at the cloud level.
It breaks application containers into bite-sized units to ease management and orchestration. Kubernetes aids the flexibility and scalability of applications by providing developers with the necessary resources and tools to manage their applications.
To explore the Kubernetes system, you need to create a Kubernetes cluster where the containerized application is deployed, launched to the public, scaled, and updated when required. Kubernetes also has container healing mechanisms that repair or eliminate dysfunctional or dead containers, which boosts software reliability and efficiency.
What is Kubernetes monitoring?
Kubernetes monitoring is the process of analyzing and managing the performance of containers in the Kubernetes clusters. It includes the collation of performance data for troubleshooting insight. This exercise enables tracking and discovering issues and fixing the same on time to ensure proper performance of nodes and achieve end-user satisfaction.
Although Kubernetes has in-built monitoring plug-ins, they do not provide the granular visibility required for efficient container monitoring and troubleshooting. As Kubernetes needs more than monitoring the CPU, memory, and storage, traditional monitoring tools also can not efficiently monitor the multitude of components enabled by Kubernetes. As a result, several out-of-the-grid monitoring solutions provide timely and efficient visibility of your Kubernetes clusters.
Why is Kubernetes monitoring important?
Kubernetes monitoring provides key real-time performance insights to fix issues while maximizing application uptime. It enables visibility into the clusters and nodes, helping with insight into what works well and what does not. Therefore, Kubernetes monitoring aids timeous response to issues.
Kubernetes monitoring helps in application upgrades. It lets you know what node to improve, the best approach to scaling, and what pods are dead or dysfunctional. This guarantees a seamless end-user’s experience. In summary, it improves planning and enhances cluster control and protection.
What Kubernetes metrics should you measure?
Accurate coordination of metrics is a crucial Kubernetes monitoring best practice. You must measure the right metrics to achieve end-to-end visibility of your Kubernetes clusters.
Metrics are essential in setting up dashboard activities and alerts, and they provide insight into both the Kubernetes system and the applications running within it.
You can fetch Metrics from the cAdvisor, Metrics Server, Kubernetes API Server, and Kube-state-metrics, among others. Some of the key metrics you should measure in Kubernetes are:
a. Cluster monitoring
The Kubernetes cluster is the chief host for all containers and the machines that run the applications. Therefore, monitoring its environment and the well-being of its components, such as nodes and pods, is vital to successful container management.
Key elements you should monitor in a Kubernetes cluster are:
1. Cluster nodes
In a cluster are nodes that enable the running of applications. These nodes comprise several resources that allow them to carry out their function. You must observe these resources and monitor their health. Worker nodes host the containers while the master nodes manage the worker nodes’ activities.
2. Cluster pods
A pod is a group of one or more containers. The pods are the smallest units in a cluster. The amount of pods running at a time determines the number of nodes to be deployed. Checking the pod’s health and resource usage is critical to efficient Kubernetes monitoring.
3. Resource utilization
Understanding this metric reveals the cluster nodes’ strengths and weaknesses and helps to determine what’s sufficient and what’s in excess. You should check for resources, including disk utilization, memory utilization, CPU utilization, network bandwidth, and many others.
b. Pod monitoring
A pod is a group of containers deployed into a node. It is foundational to the Kubernetes ecosystem and requires proper monitoring. Check for the following metrics for efficient pod monitoring:
1. Container metrics
Excess or insufficient pods could affect the application performance. You must understand the number of containers running in a pod and how to regulate them. Track the cycle of the various containers in your pods, and ensure you only burden each pod with what it can bear. Do not overestimate pod scalability.
2. Application metrics
Application metrics measure the cycle and performance of the application, providing industry-specific information regarding the business the application was developed for.
In addition, application metrics provide visibility into traffic, the rate of failed requests, the amount of time a request took, the most and the least used features of the applications, and several other vital information.
3. Kubernetes scaling and availability metrics
The seamlessness of scaling up and down your containers is one of Kubernetes’ key features. Since the number of containers or pods in a cluster determines the number of nodes, understanding the scaling and availability capacities helps in configuring auto-scaling tools for your Kubernetes clusters.
4. Load average
Load average is a count of programs running or waiting to run in the CPU. As a rule of thumb, you must ensure that your load average does not exceed the number of cores on your host.
While a high load average alone is not always an indicator of a problem, it can become one if it is accompanied by high sys CPU usage or high I/O wait. Therefore, you need to constantly monitor your application’s load average to quickly and efficiently troubleshoot issues if they occur.
5. Resource request and limit
Each container has an associated request which runs on a predetermined CPU and memory. The Kubernetes scheduler uses these requests to ensure that only the node with the requisite capacity to host a requesting pod hosts it.
Both underutilization and overutilization can be disastrous. Underutilization is a situation where the container requests outmatch the actual usage and leads to inefficient resource utilization, which means you are paying for what you are not using.
When the pod’s requests are lower than its actual usage, over-utilization happens, and your applications work slower due to insufficient resources on the node. To avoid these extremes, keep a grip on your nodes’ resource requests and limits. Aim for up to 80% actual usage on the 90th percentile for both resource requests and limits.
Monitoring Kubernetes: Key methods
You can monitor your Kubernetes cluster nodes in two ways: using the daemonsets and heapster. Either help collect metrics from the cluster and transmit these to an external endpoint for further analysis.
Monitoring using Kubernetes DaemonSets
The Kubernetes DaemonSets monitors individual pods and ensures each runs on every node in the cluster. It reports the ability of a node to run the pods allotted to it. As a workload tool, object, or specialized pod, it is a monitoring agent that collects critical resource metrics from the containers and the node host and sends them to the API server.
Since the daemonset is a pod itself, you can create your specialized monitoring daemonset, which functions as a sister pod to your nodes. You can thereafter configure Kubernetes to affix this Daemonset to each node you create automatically.
This enables the Daemonset to watch the node and its constituents, and as each node gets terminated either manually (by you) or automatically (by Kubernetes self-healers), its designated monitoring daemonset is also terminated.
Kubernetes monitoring using Heapster
Heapster is a monitoring pod that collects and interprets signals and Kubernetes metrics. It serves as a link between the cluster and backend storage that also serves as a log collector. Heapster enables performance analysis and visualization.
Heapster queries the nodes about the containers running in them. It works with the cAdvisor to expose container metrics like the CPU, network, and memory usage. To efficiently monitor your containers using the heapster method, you must use the pod in conjunction with a time-series database (TSDB) like InfluxDB and a visualization tool like Grafana. This requires you to deploy InfluxDB and Grafana and edit the Heapster deployment to send data to InfluxDB.
These prerequisites make the heapster monitoring method more complex than the daemonset method.
Monitoring K8s with Middleware
Middleware integrates each part of your Kubernetes cluster to provide you with a complete picture of health & performance. After installing the Middleware agent, it collects metrics, events, and logs from your cluster components, workload pods, and other Kubernetes objects.
The Middleware agent integrates with container platforms like docker to collate container-level metrics and a detailed breakdown of your container resources. This allows you to monitor relevant Kubernetes metrics at the pod and cluster-level.
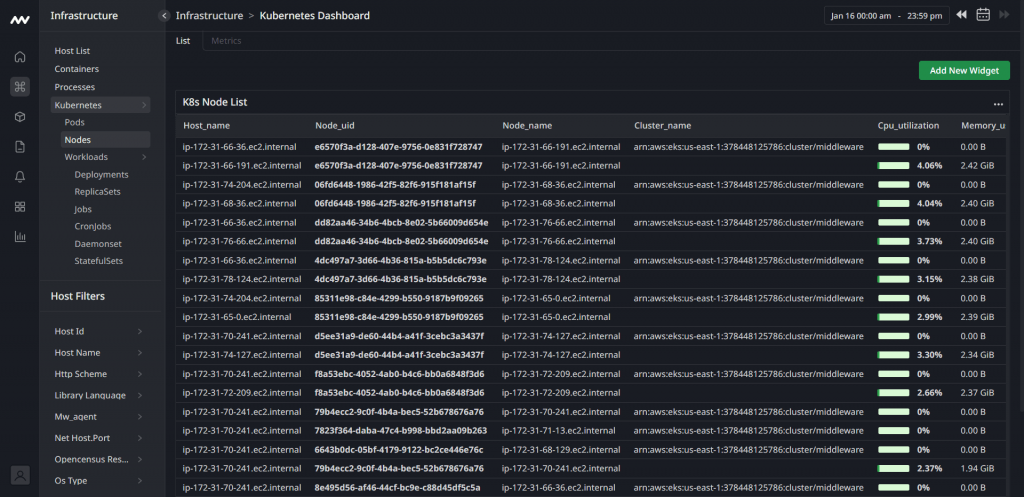
For node monitoring, the agent provides you with a monitoring dashboard graphically illustrated below:
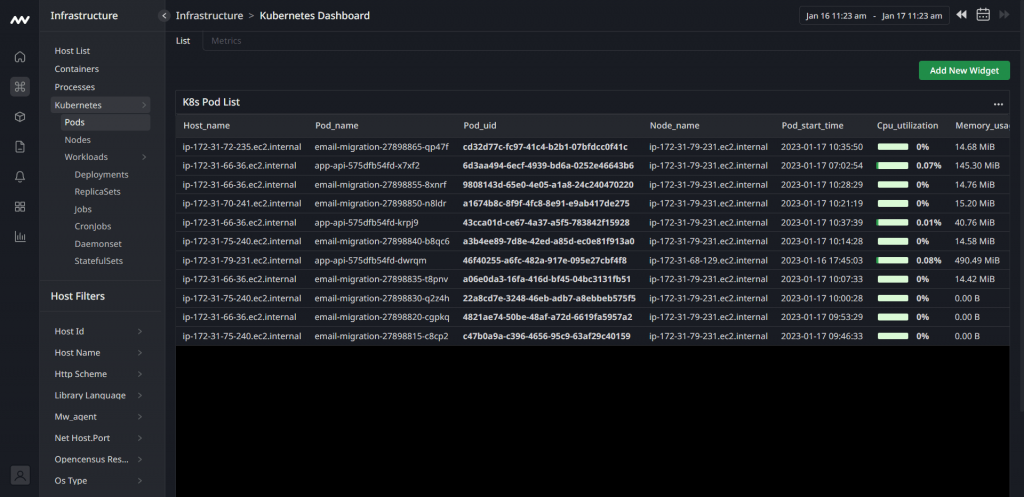
And, for pods, the dashboard displays the pod name and uid in sequential order, as shown in this image:
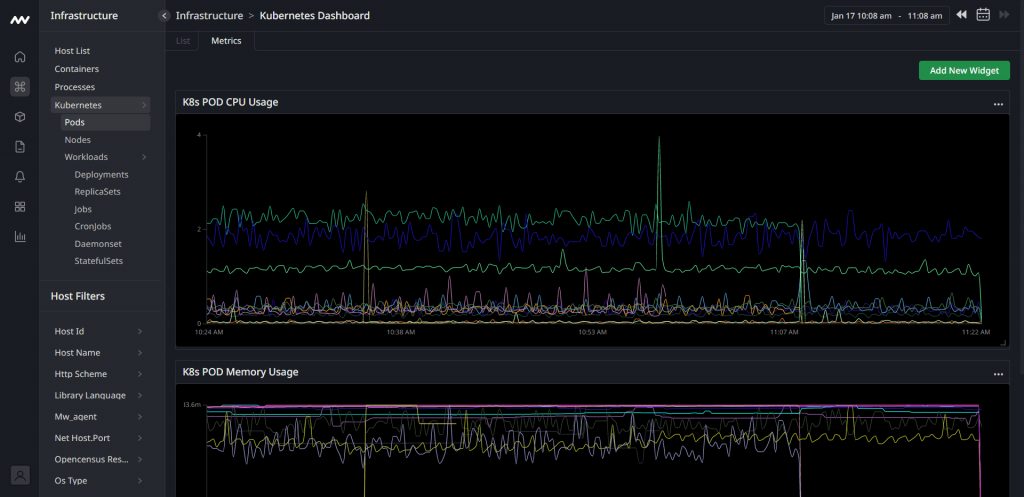
Similarly, for granular visibility into the CPU usage of your pods, the Middleware agent is also equipped to display this. Here is a typical CPU usage dashboard for pods:
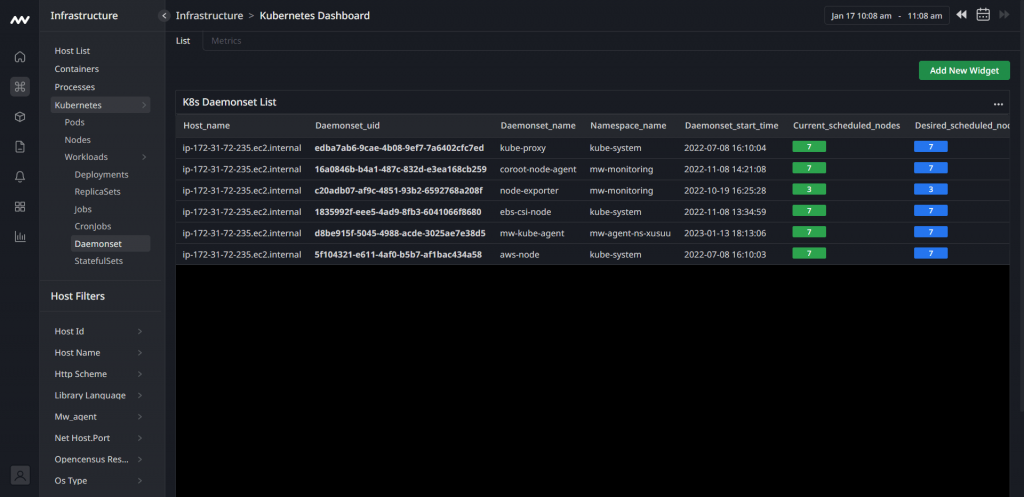
Aside from pods and node visibility, Middleware also monitors and collects metrics of the daemonsets that help deploy ongoing background tasks that you need to run on all or certain nodes. Middleware collects metrics on all daemons, including storage and log collection. A typical daemonsets monitor looks as displayed below:
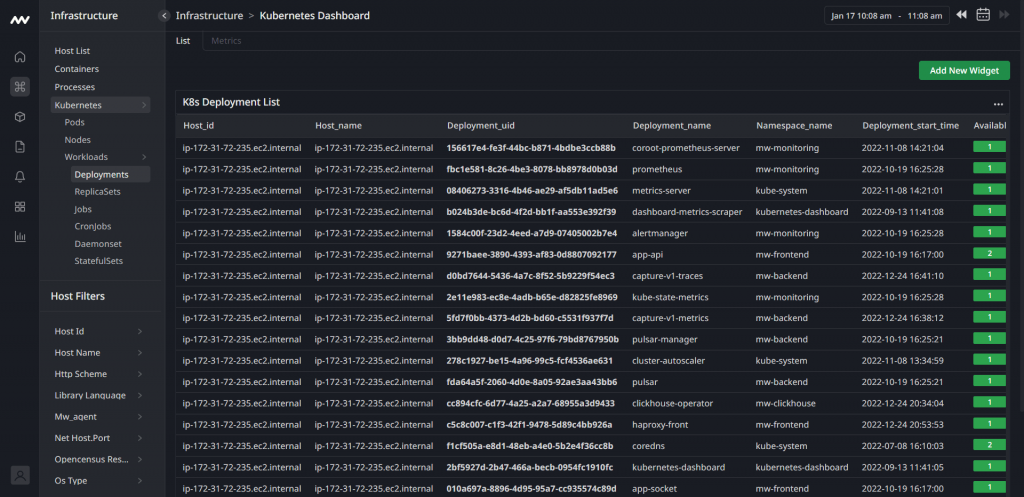
Within the Kubernetes dashboard of Middleware, you can also monitor what’s going on in your deployments:

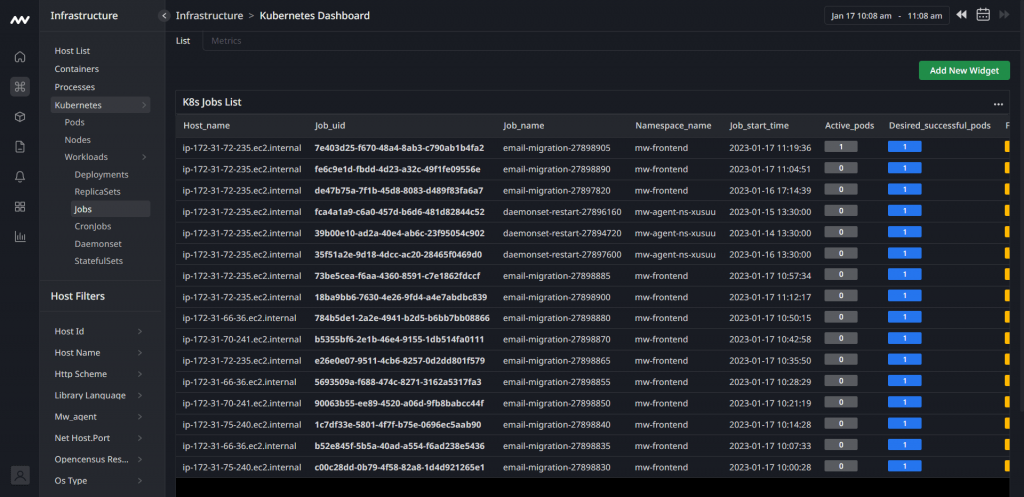
And even jobs:
In summary, Middleware is an all-in-one monitoring solution for your Kubernetes containers, and you can start for free now. Sign up here.
Kubernetes monitoring best practices
While monitoring or attempting to monitor the Kubernetes clusters, you must follow certain practices for the best results.
The following are some of the practical and Kubernetes monitoring best practices that have been implemented from time to time:
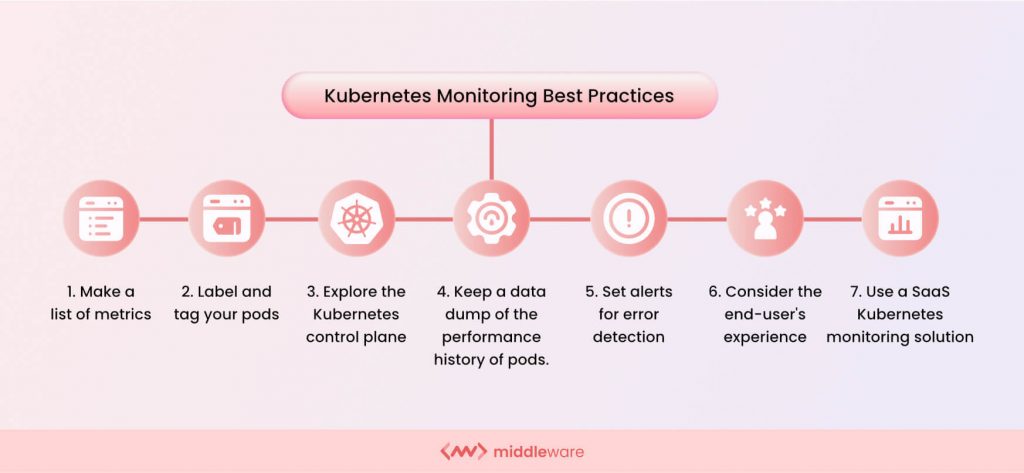
1. Make a list of metrics you intend to monitor. As earlier emphasized, the cluster nodes, pods, applications, and related resources are vital metrics to monitor Kubernetes. You should list these components and resources to ensure proper coverage.
2. Label and tag your pods for optimal interaction and ease of monitoring in the cluster. In a system that allows such the magnitude of containers as Kubernetes allows, logical labeling and systematic tagging are essential. This tagging and labeling can be application-specific or location-specific. Whichever style you adopt will help with straightforward and comprehensive filtering of your clusters.
3. Explore the Kubernetes control plane to access details of cluster performances and detect issues with the Kubernetes microservices. This API metric is highly effective as it gives comprehensive visibility of the Kubernetes clusters.
4. Keep a data dump of the performance history of pods. This provides you with a root cause analysis of problems and hints on how to improve the components in the future. It also helps you to predict the future performance of your clusters.
5. Set alerts for error detection and other system performance reports. While alerts help fix issues, they must be configured for only significant, intelligent, and actionable events to avoid unnecessary distractions or alert fatigue. The alert can also be configured to be sent via push notifications, emails, or pagers.
6. Consider the end-users experience by configuring a monitoring setting on your application that detects and gives information on users’ interaction with the application. This helps with improving usability and front-end experience.
7. Use a SaaS Kubernetes monitoring solution that provides granular visibility and detailed analysis of every component of your clusters and the entire Kubernetes ecosystem. While Kubernetes and its features provide system monitoring, the tools are ineffective enough for comprehensive coverage of situations in the Kubernetes ecosystem.
Select a good monitoring solution that simplifies the monitoring process without compromising the granularity of your visibility into the Kubernetes objects.
Top 3 Kubernetes monitoring tools
While there are several out-of-the-box Kubernetes monitoring tools for monitoring the health and performance of the Kubernetes clusters. Very few provide the granular visibility required for effective monitoring. Here are the three of the most efficient Kubernetes monitoring tools:
1. Middleware
Middleware is a full-stack observability platform that offers Kubernetes monitoring solution for both traditional and microservice-based applications deployed on Kubernetes. It captures metrics and events in real-time and allows you to set up alerts and notifications on the metrics that matter most to you. Middleware provides several out-of-the-box reports, charts, and alerts to save you time.
Middleware uses eBPF based kernel agent, which is lightweight and easy to install. It allows you to add multiple datasets in one single dashboard. To get started, sign up for free and install the Middleware agent.
2. Datadog
Datadog is an APM solution that extracts logs, metrics, events, and service states from Kubernetes in real-time. It enables you to monitor, troubleshoot and optimize application performance. Datadog features dashboards and high-resolution metrics and events for manipulation and graphing. You can run the Datadog agent using a DaemonSet that will be deployed to every cluster node.
The Datadog Agent is easy to install and integrates well with other infrastructures. However, it is expensive, and the log integrations can be confusing.
3. Dynatrace
Dynatrace simplifies monitoring K-native and managed services like OpenShift, EKS, AKS, GKE, IBM IKS, and several others. By deploying and managing the Dynatrace OneAgent Operator, it tracks cluster availability, health, and resource utilization.
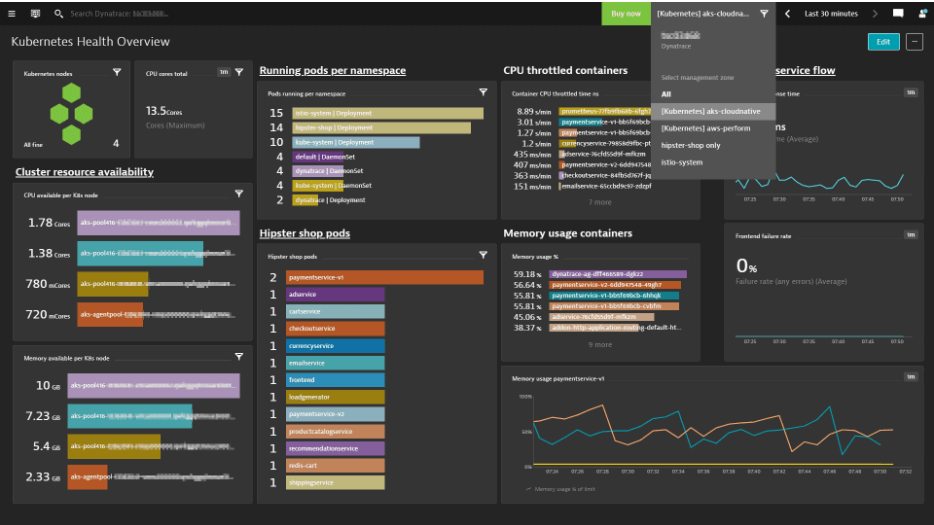
Dynatrace is easy to install but expensive and has a steep learning curve to maximize its monitoring capabilities fully.
Conclusion
Kubernetes enables the deployment of hundreds of containerized applications in its clusters. The clusters contain nodes that engineer the containers. The ability to achieve observability over these machines and components in a glance-like approach is vital to the efficiency of Kubernetes’ orchestration of your containers.
Kubernetes monitoring is needed to deeply examine the relationships and interactions that make up the ecosystem. Although Kubernetes has in-built monitoring features such as the control plane, they do not possess the sophistication to provide detailed analysis and granular visibility into application workload, event logging, and other microservice metrics in the Kubernetes clusters.
Therefore, you need a stellar Software-as-a-Service (SaaS) monitoring solution for detailed visibility. Middleware provides such end-to-end visibility. It is a Kubernetes performance monitoring solution that helps you monitor Kubernetes and its associated infrastructures and integrates well with existing infrastructures and tools. Start for free today!