In this article, we will cover Golang monitoring from ground up. We will talk about importance of Golang monitoring, it's benefits, best Golang monitoring tools and more!
Developers continue to seek faster production cycles and iterate with solutions that quicken the Software delivery lifecycle. They iterate with cloud service providers, container orchestration tools, and programming languages and leapfrog from tool to tool.
As an open-sourced, statically typed high-level programming language, Golang offers code efficiency for faster software delivery. Also known as Go, Google developed it in 2007 to outmatch other programming languages like C, JavaScript, and Python in speed.
Although Golang bears syntactical similarity to the C programming language, it is built with greater simplicity as it possesses garbage collection, structural typing, and CSP-style concurrency. However, given Golang’s vastness, it requires proper monitoring for run-time efficiency. In this article, we deep-dive into Golang monitoring and its importance in the efficiency of Golang applications.
What is Golang monitoring?
Golang monitoring is the practice of managing Golang infrastructures and observing the performance of its applications. It involves collecting and analyzing performance data and tracking applications’ availability to understand their behaviors and ensure proper service delivery.
Golang application monitoring enables developers to identify issues, optimize performance, and ensure that the application functions as intended. Having a glance at the whole Golang architecture reveals the health status of every application and helps with quick discovery and troubleshooting of problems.
It is a monitoring best practice to gather relevant metrics such as memory storage, error rates, and latency for effective results. Setting up a notification feature for alerting is also vital, as well as monitoring dependencies to understand how they affect your application’s performance.
The monitoring exercise is crucial for distributed applications and microservices, which are composed of many small services running on different virtual machines. Identifying the source of performance issues or errors could be difficult without monitoring such environments.
Importance of performance monitoring in Golang applications
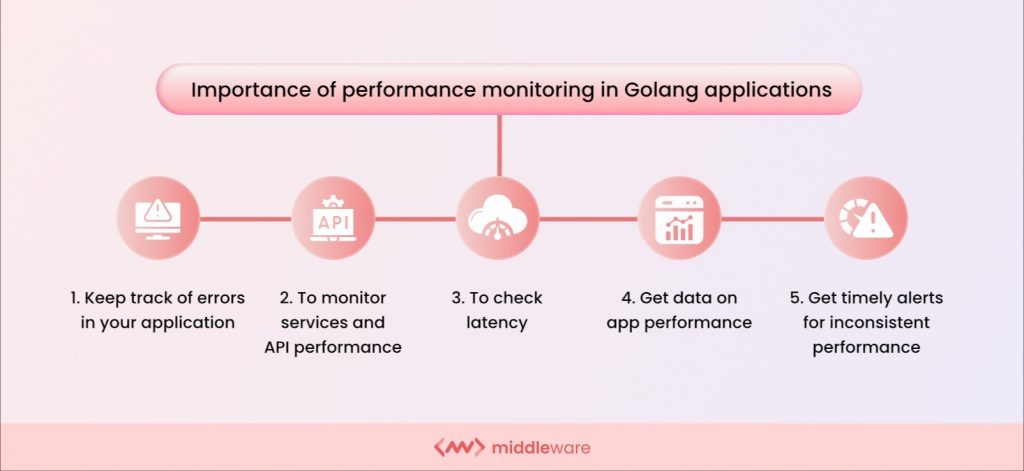
Golang application performance monitoring fosters the availability and scalability of Golang applications. Some of the key importance of Golang performance monitoring are:
1. Error tracking
Golang performance monitoring enables you to keep track of errors in your application and enables quick response to the same. By keeping tabs on key metrics such as memory usage, CPU utilization, and network traffic, you can detect timely errors and fix them before they go out of hand. This helps enhance user experience.
2. Services and API performance
Monitoring your Golang applications provides you with services and API performance metrics, which are resourceful information for improving your applications. These metrics may include the most frequently used endpoints, excessive resource consumption, and slow queries, and they help you maintain the reliability of your software.
3. Latency checks
An application that takes longer than three seconds to load loses users and potential customers. Latency checks provide information about your application’s performance too slowly and provide root cause analysis to optimize software health.
4. Performance feedback
Real-time and real-life data on application performance helps in the overall optimization of Golang infrastructures. Monitoring provides you with intelligence-based data on application performance, which helps in the troubleshooting exercise. These data are sometimes displayed in charts and graphs depending on the implemented monitoring tools.
5. Timely Alerts
Golang application monitoring also provides timely and timeous alerts on inconsistent performance or misbehavior, such as memory leaks, suspicious intrusion, or when certain thresholds are exceeded. You can configure this alert feature to send notifications on critical events to specific teams that will take action. This real-time error detection feature helps minimize application downtime by enabling swift troubleshooting and fixing.
How Golang application monitoring works
Golang application monitoring is automated to discover application topology and interdependencies and trace application behavior. It gives end-to-end visibility into your Golang environment, including its infrastructures, architecture, and applications.
It works by collecting and analyzing various metrics and data points from a running Golang application, then displaying them on the dashboard for visibility or using them to send alerts. Golang monitoring often follows this sequence:
Step 1: Instrumentation
To collect requisite metrics for monitoring, the Golang application is instrumented. This is done by adding code monitoring libraries to the application to capture critical metrics, such as CPU usage, memory consumption, error rates, network traffic, and request latency.
Step 2: Data Collection
Once the application is instrumented, data collection commences. The relevant data can be collected in the log files, system performance counters, or through any available features in a specialized monitoring tool.
Step 3: Data Aggregation
The collected or gathered data are aggregated and stored in a central location, such as a Golang database or monitoring system. This process allows for easy analysis of metrics.
Step 4: Visualization
The data or metrics are then visualized in a comprehensive display. This could be in dashboards that display end-to-end visibility into the Golang applications with charts and graphs showing events’ trends in real-time. The insights gathered from the monitoring exercise can be used to improve Golang applications.
Golang monitoring allows you to proactively identify and address issues with your application, optimize performance, and ensure availability for your users. The monitoring exercise is easily implemented using a comprehensive monitoring tool.
Step 5: Data Analysis
The collected and aggregated data are analyzed to identify patterns or anomalies that may indicate issues with the Golang application. For instance, you might look at CPU or memory usage trends over time or for correlations between request latency and error rates.
Step 6: Alerting
At this stage, alerts can be configured to notify you when certain events occur, such as high memory usage or an increase in error rates.
Monitoring Golang applications with Middleware
Middleware follows the six-tiered process of Golang monitoring highlighted above. After installing the Middleware agent, the agent instruments your application, collects data about your application and its dependencies, aggregates it, analyses it, and presents it as logs and traces in a unified dashboard.
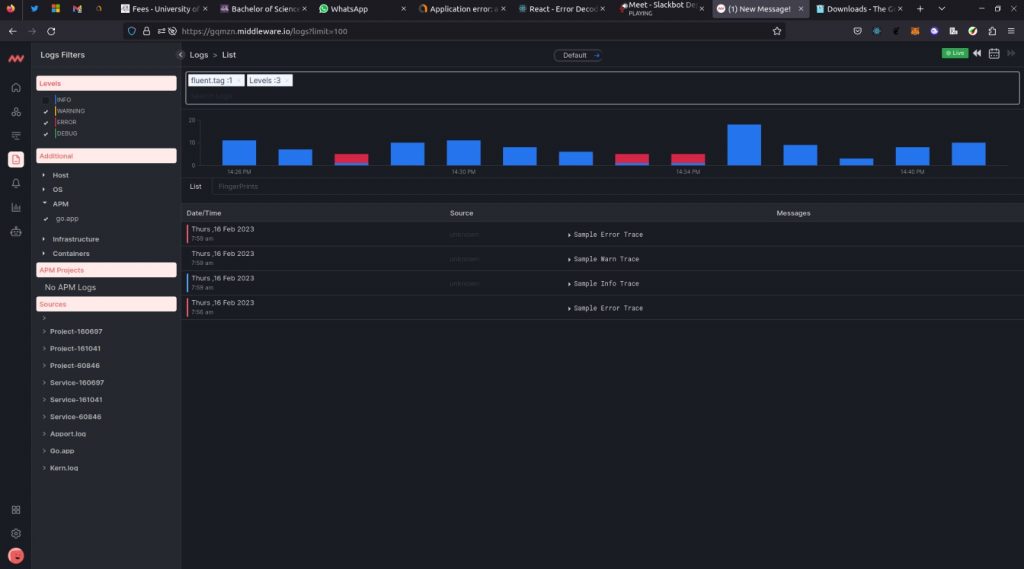
The dashboard displays the requisite information about your Golang application. To view errors and performance leaks in your Golang application, you can check the logs list, an example of which is graphically illustrated below:
Best Golang Monitoring Tools
Three of the best Golang Monitoring tools are:
1. Middleware
Middleware is a monitoring and alerting tool for managing Golang architecture at the application, endpoint, and customer levels. It gives end-to-end visibility into your Golang Infrastructures and provides root cause analysis of issues causing bottlenecks, thereby enhancing end-user experience.
Middleware is built upon the eBPF approach to application performance management. This tool is highly sophisticated, with mechanisms that display end-to-end visibility of your Golang applications and their dependencies. In addition, it has notification features that help you set alerts for the most critical metrics or events.
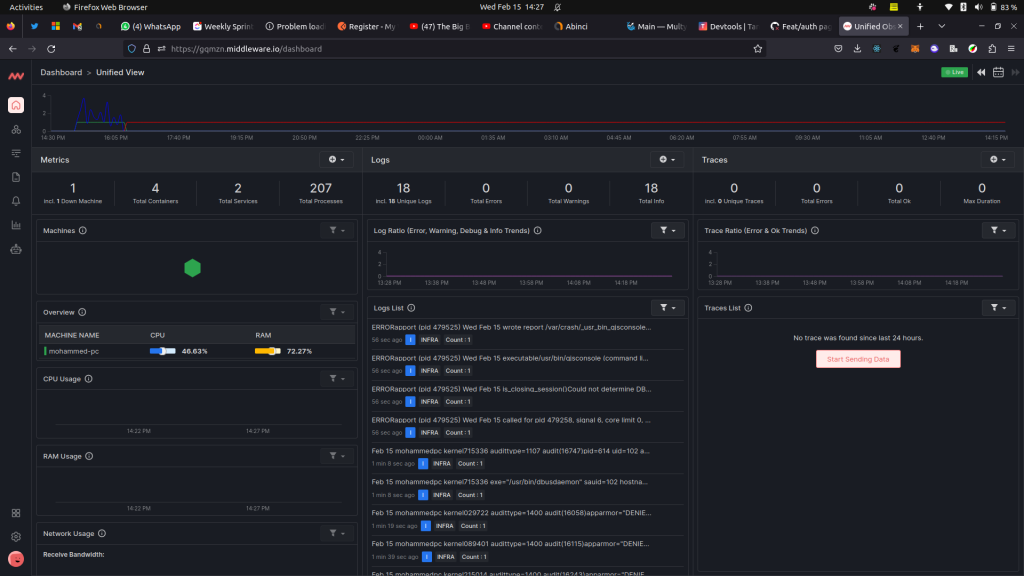
Middleware gathers all correlating metrics, logs, KPIs, traces, and data in real-time in one all-encompassing platform. Apart from simply detecting errors, this monitoring solution provides analysis that helps you properly troubleshoot and fix your applications. It is also an effective monitoring solution for Kubernetes and Node.js applications.
2. Prometheus
Prometheus is an open-source cloud monitoring tool built with a multi-dimensional data model that collects and stores time-series data and a flexible query language known as PromQL that helps in the real-time selection and aggregation of time-series data.
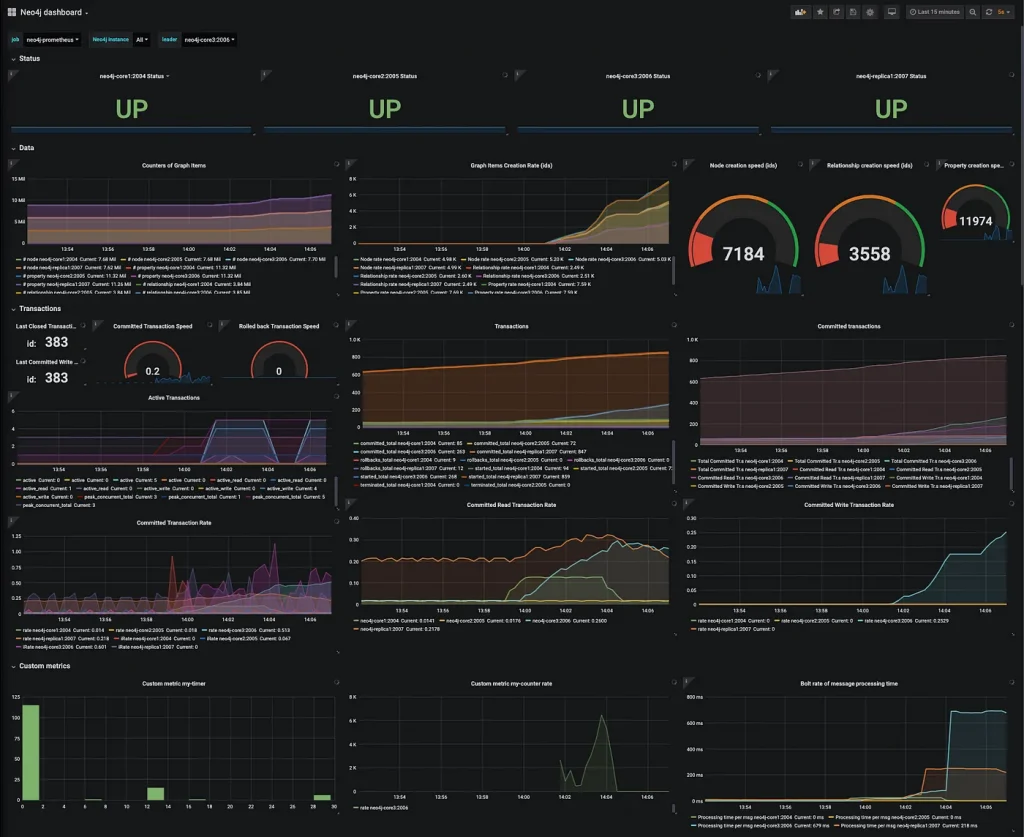
The tool effectively juxtaposes data from previous events with the system’s current situation. This helps you to understand the progress or otherwise of your Golang application’s performance. It also has a notification feature that sends alerts at important but critical events.
3. Grafana
Grafana is a monitoring tool with great visualization and dashboarding features that display the performance or condition of your application in charts and graphs for easier interpretation and understanding. It runs data analytics on your Golang infrastructures and provides insight into the Golang environment and performance.
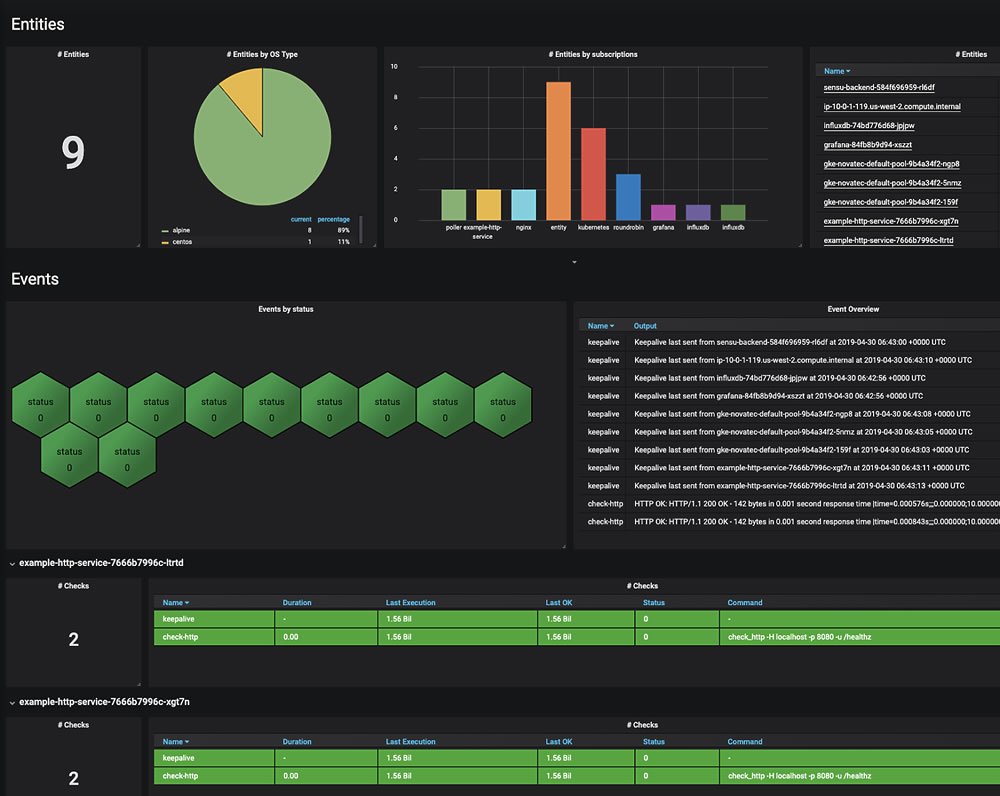
With Grafana, you can create visualizations, such as graphs, tables, and alerts, and organize them into dashboards to monitor and analyze real-time data. It also offers templating, annotations, and alerts to help users build complex, customized dashboards.
Conclusion
For its speed, flexibility, and scalability, developers have migrated from other programming languages to Golang, an excellent language for building high-performance and scalable services. Although Golang provides various built-in tools and libraries for monitoring applications, such as profiling, tracing, and metrics collection, these tools do not possess end-to-end visibility features.
The monitoring ecosystem in Golang is continually evolving and expanding, with numerous open-source libraries and tools available to developers. Golang’s simplicity, concurrency support, and built-in garbage collector make it an excellent language for building microservices, which can be monitored and managed effectively using these monitoring tools.
Monitoring is essential to ensuring that Golang applications perform optimally and reliably. By leveraging the correct monitoring tools like Middleware, developers can gain insight into their applications’ behavior and quickly diagnose and resolve issues, improving their reliability and uptime.
Middleware provides detailed performance data through graphical, end-to-end visibility that helps you discover faults and provides information on what needs to be improved.

